Fig. 5
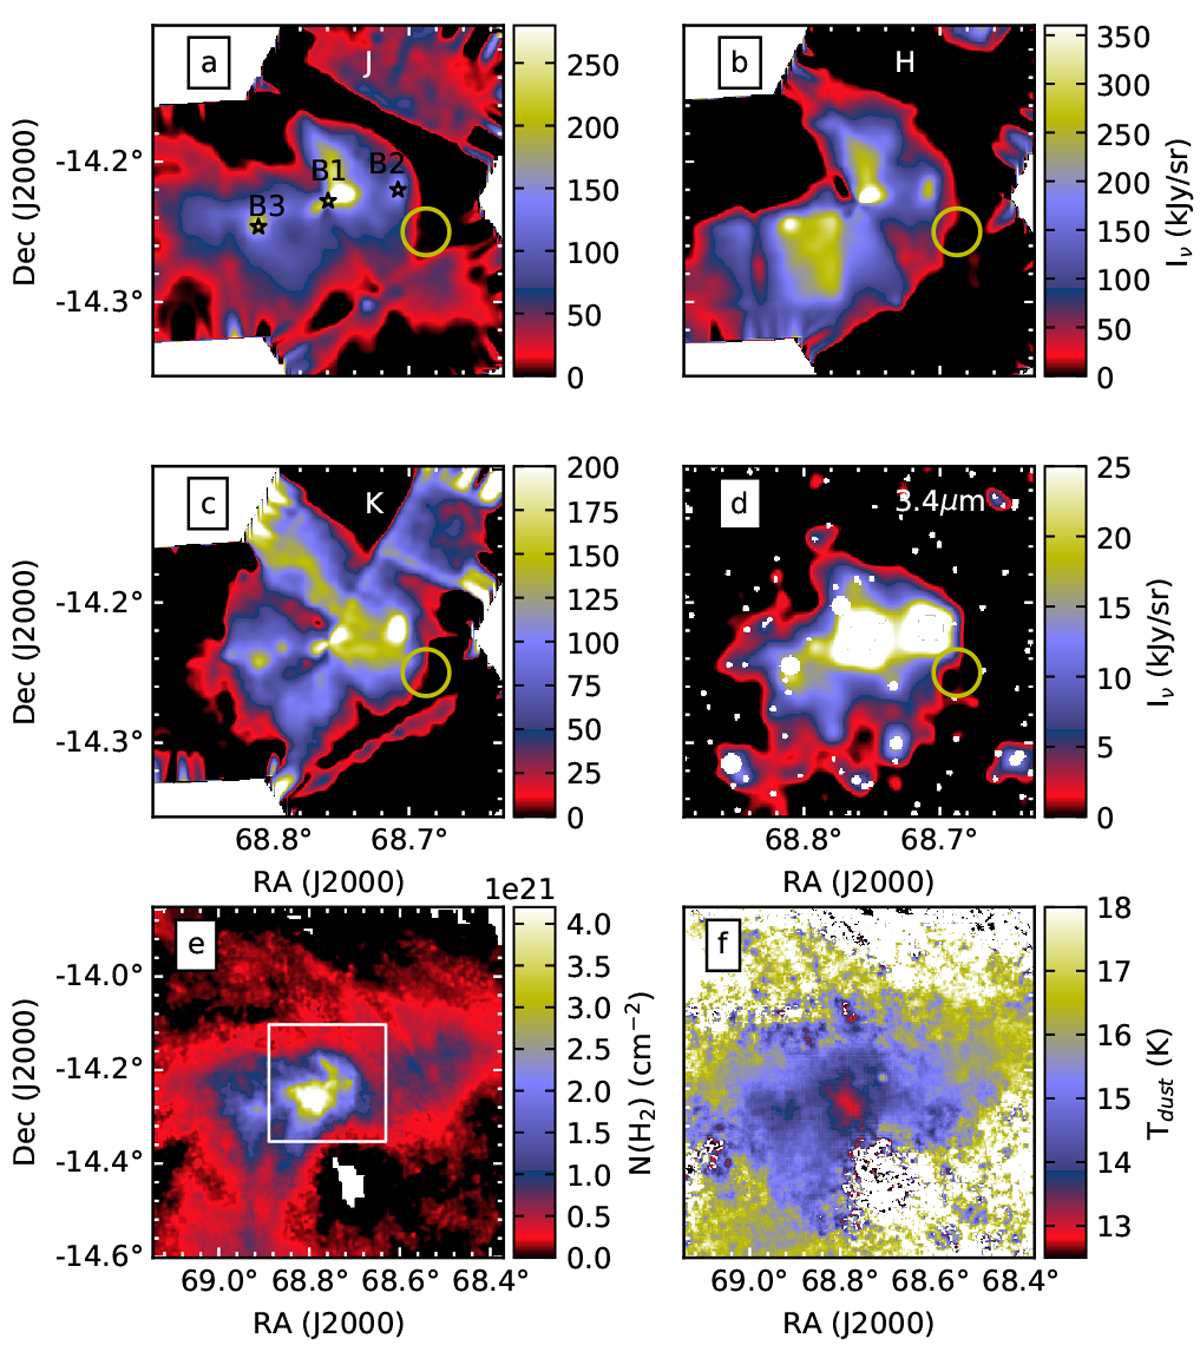
Observed surface brightness in J, H, KS, and WISE 3.4 μm bands (frames a–d, respectively). Herschel column density and dust temperature maps are shown in frames e and f. Bright stars identified by DAOPHOT were removed and replaced with interpolated surface brightness, and faint stars have been eliminated with median filtering. In the WISE 3.4 μm band image (frame d), the white regions correspond to areas around bright stars that were excluded from subsequent analysis. The YSOs B1–B3, are identified in frame a. The yellow circle in frames a–d indicate the reference region used for setting a common zero level. The white box in frame e corresponds to the extent of the J, H, KS, and 3.4 μm maps (the area shown in frames a–d).
Current usage metrics show cumulative count of Article Views (full-text article views including HTML views, PDF and ePub downloads, according to the available data) and Abstracts Views on Vision4Press platform.
Data correspond to usage on the plateform after 2015. The current usage metrics is available 48-96 hours after online publication and is updated daily on week days.
Initial download of the metrics may take a while.