Free Access
Fig. B.4
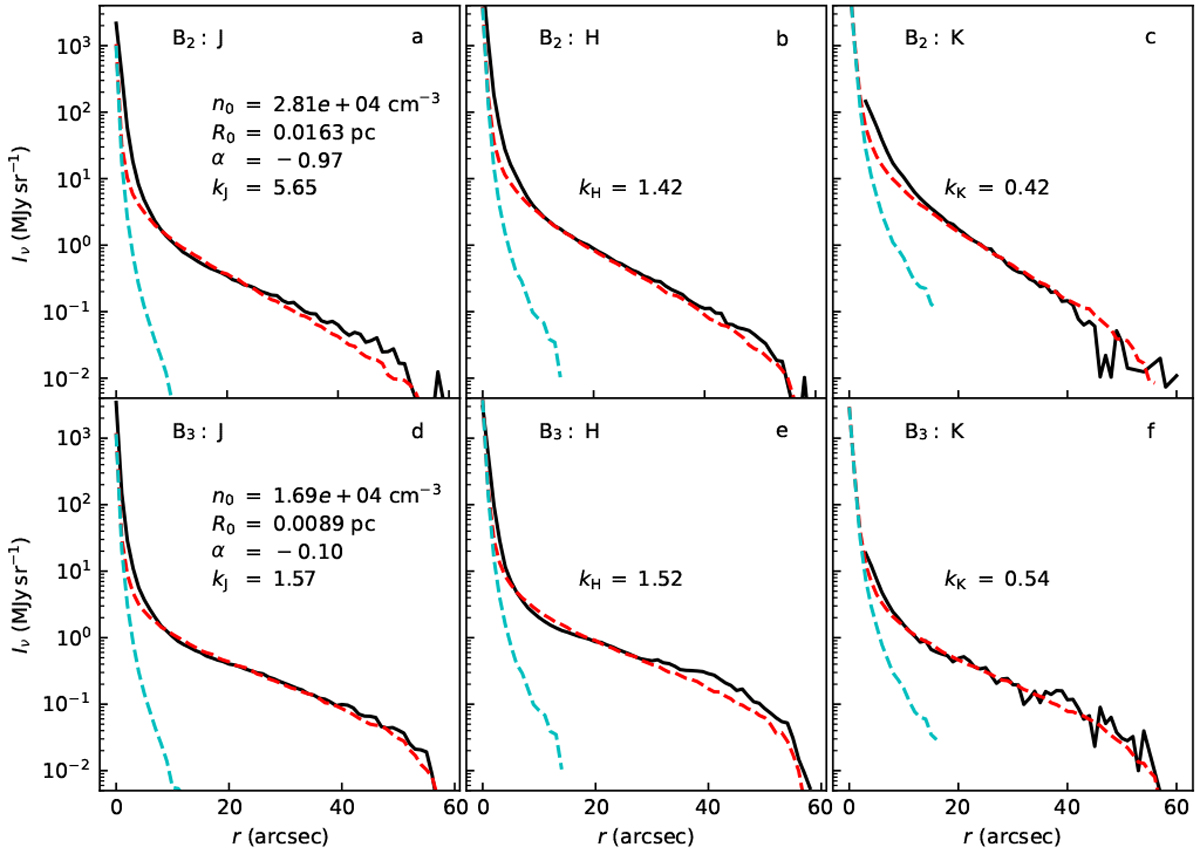
Surface brightness profiles in the vicinity of the embedded sources B2 (frames a–c) and B3 (frames d–f), for the J, H, and KS bands. This plot is the same as Fig. 11 but with the AMMI dust model (Ysard et al. 2016).
Current usage metrics show cumulative count of Article Views (full-text article views including HTML views, PDF and ePub downloads, according to the available data) and Abstracts Views on Vision4Press platform.
Data correspond to usage on the plateform after 2015. The current usage metrics is available 48-96 hours after online publication and is updated daily on week days.
Initial download of the metrics may take a while.