Fig. B.3
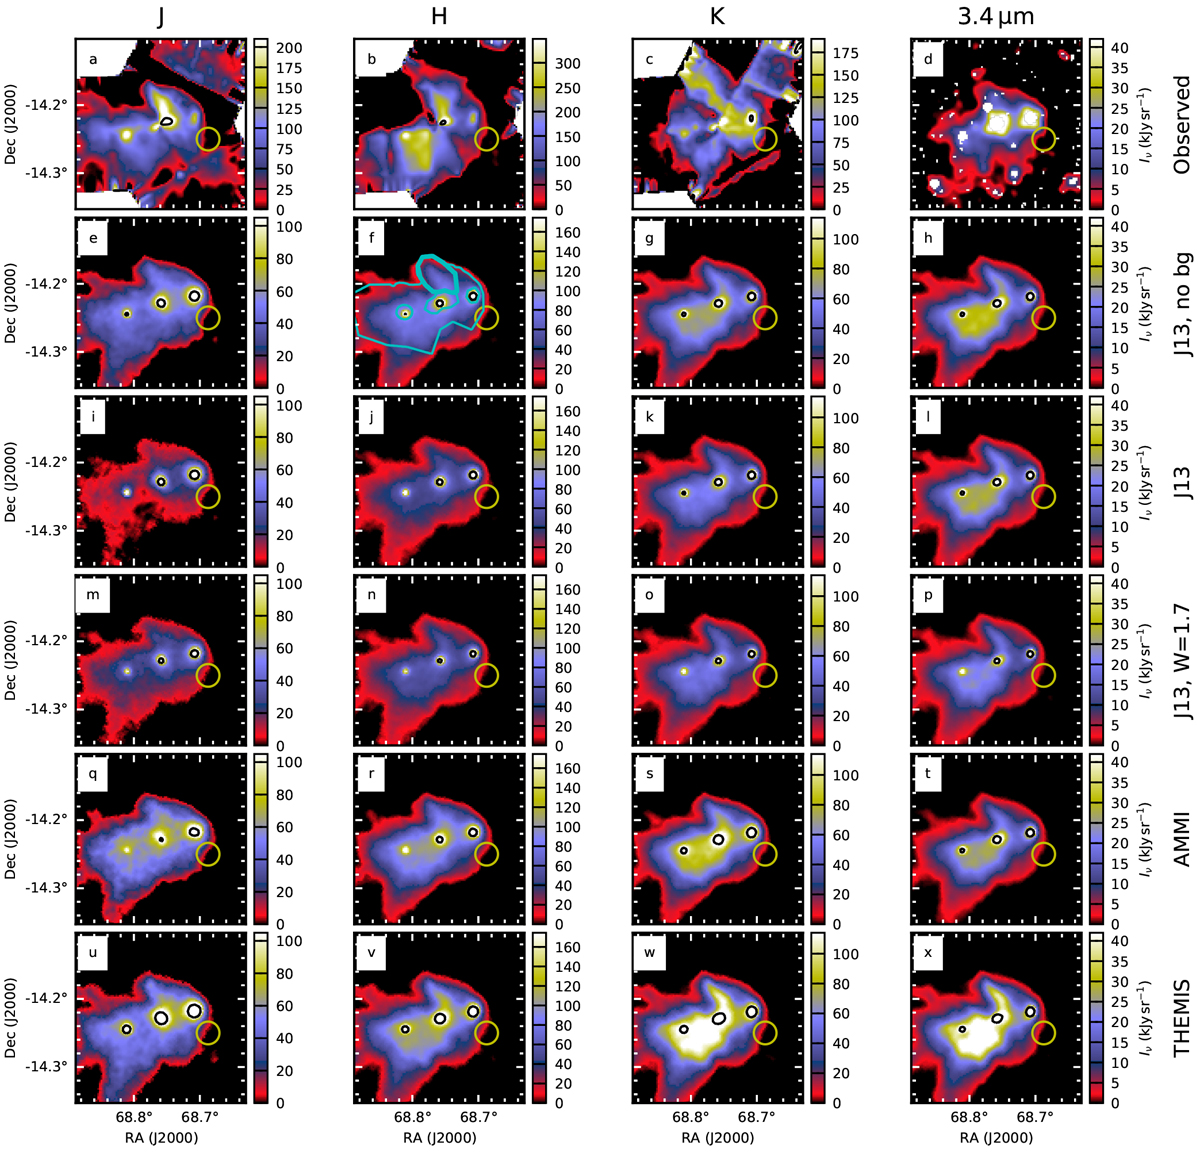
Comparison of 1.25–3.4 μm surface brightness between observations and models. The figure is the same as Fig. 8 but the model clouds have lower column densities that correspond to the NICER NIR extinction measurements. The colour scales are the same for all model plots of the same band. The yellow circles indicate the reference region used for background subtraction. The black contours are drawn at 1.5 times the maximum of the colour scale.
Current usage metrics show cumulative count of Article Views (full-text article views including HTML views, PDF and ePub downloads, according to the available data) and Abstracts Views on Vision4Press platform.
Data correspond to usage on the plateform after 2015. The current usage metrics is available 48-96 hours after online publication and is updated daily on week days.
Initial download of the metrics may take a while.