Fig. A.2
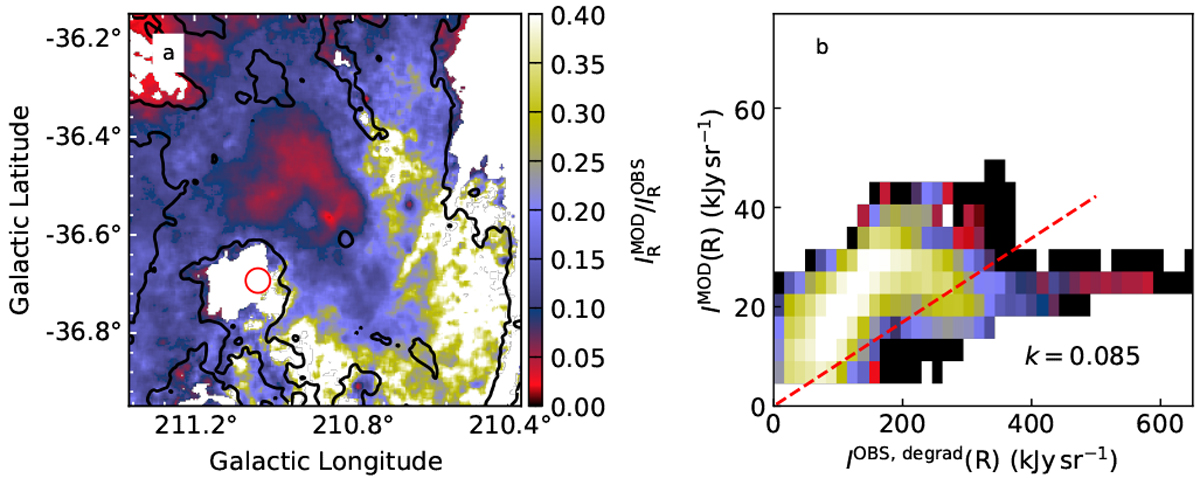
Comparison of observed and modelled (J13, W = 1) R-band surface brightness. Frame a: map of the ratio ![]() with contours at
with contours at ![]() equal to 20 kJy sr−1 and 40 kJy sr−1 (cf. Fig. 7a). The red circle indicates the reference area used for establishing a common zero point. Frame b: correlation as 2d histogram, with a logarithmic colour scale for the point density.
equal to 20 kJy sr−1 and 40 kJy sr−1 (cf. Fig. 7a). The red circle indicates the reference area used for establishing a common zero point. Frame b: correlation as 2d histogram, with a logarithmic colour scale for the point density.
![]() stands for observations corrected for the main gradient. The dashed line shows the least-squares fit to data with
stands for observations corrected for the main gradient. The dashed line shows the least-squares fit to data with
![]() kJy sr−1. The effect of background sky brightness is not included in the model.
kJy sr−1. The effect of background sky brightness is not included in the model.
Current usage metrics show cumulative count of Article Views (full-text article views including HTML views, PDF and ePub downloads, according to the available data) and Abstracts Views on Vision4Press platform.
Data correspond to usage on the plateform after 2015. The current usage metrics is available 48-96 hours after online publication and is updated daily on week days.
Initial download of the metrics may take a while.