Fig. 13
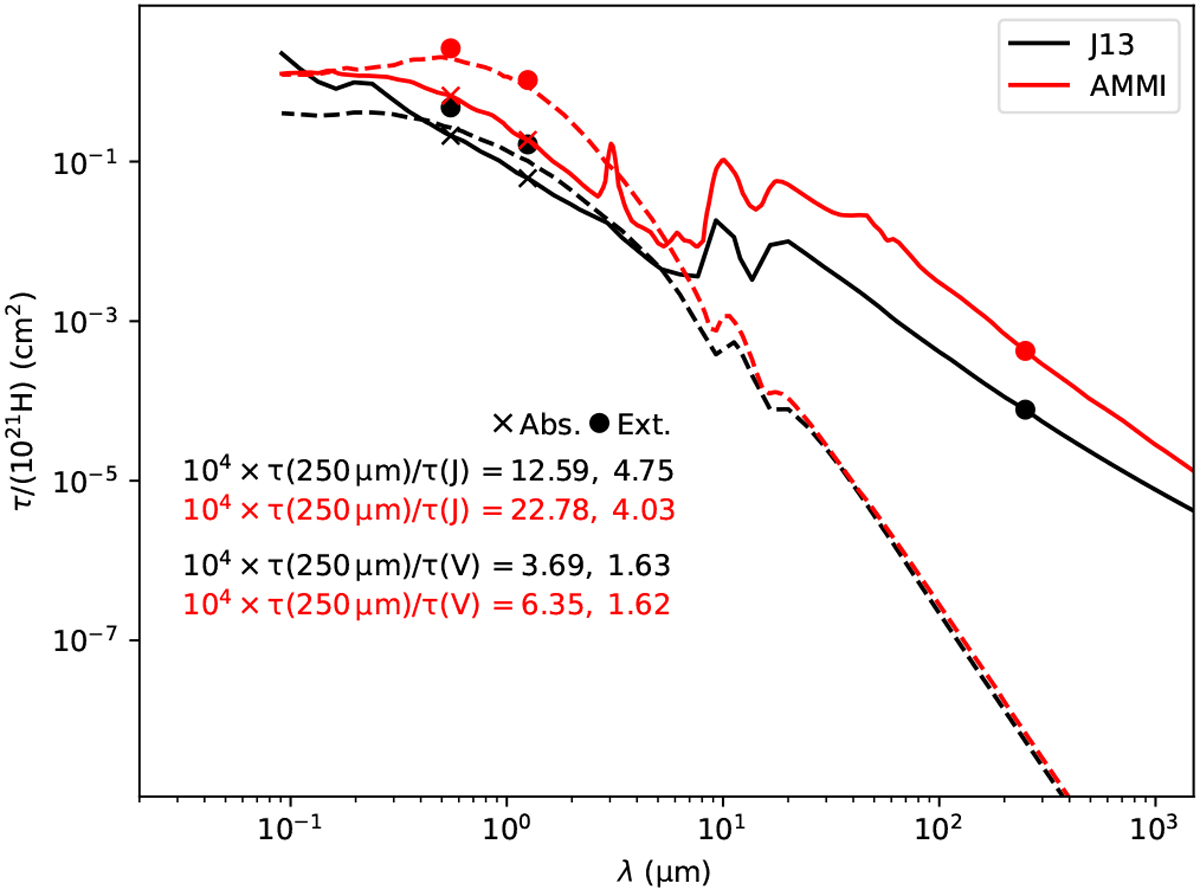
Dust optical depth for J13 and AMMI models relative to hydrogen column density N(H) = 1021 cm−2. The solid lines are for absorption and the dashed lines for scattering. The plot lists τ(250 μm)∕τ(J) ratios where the first number corresponds to absorption (points marked with crosses) and the second to extinction (marked with circles).
Current usage metrics show cumulative count of Article Views (full-text article views including HTML views, PDF and ePub downloads, according to the available data) and Abstracts Views on Vision4Press platform.
Data correspond to usage on the plateform after 2015. The current usage metrics is available 48-96 hours after online publication and is updated daily on week days.
Initial download of the metrics may take a while.