Fig. 12
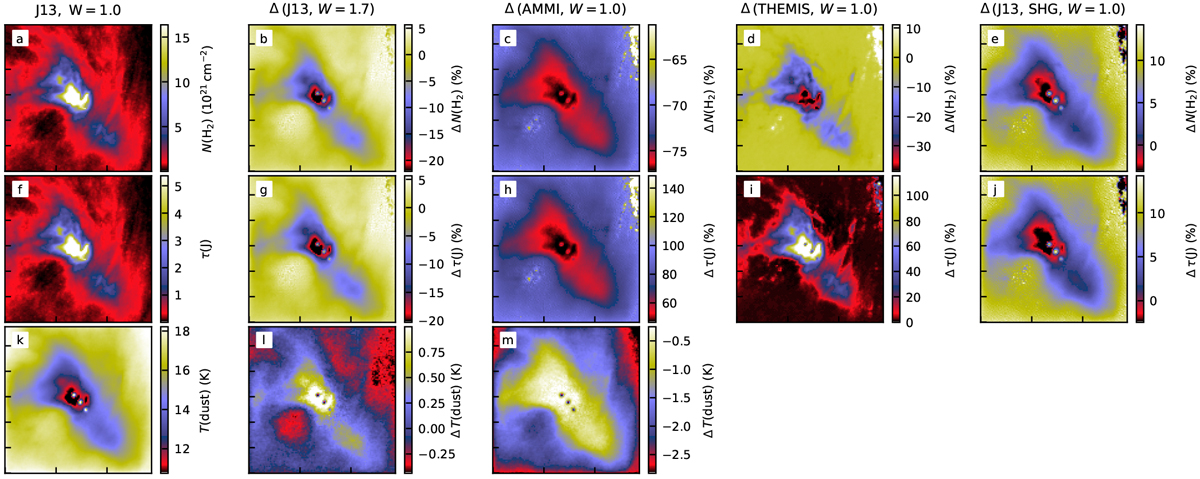
Comparison of model column density N(H2) (first row), NIR optical depth τ(J) (second row), and a cross section of the physical dust temperature T(dust) (third row) in alternative models. The first column shows the reference model with J13 dust and W = 1 LOS cloud extent. The other frames show differences to this model, for the dust and W values indicated on top. The last column (J13, SHG) is the same as the reference model but with calculations including the full treatment of stochastic heating. Temperature maps are not shown for the THEMIS and stochastically-heated-grain cases, wherethere is no single temperature per cell.
Current usage metrics show cumulative count of Article Views (full-text article views including HTML views, PDF and ePub downloads, according to the available data) and Abstracts Views on Vision4Press platform.
Data correspond to usage on the plateform after 2015. The current usage metrics is available 48-96 hours after online publication and is updated daily on week days.
Initial download of the metrics may take a while.