Fig. 11
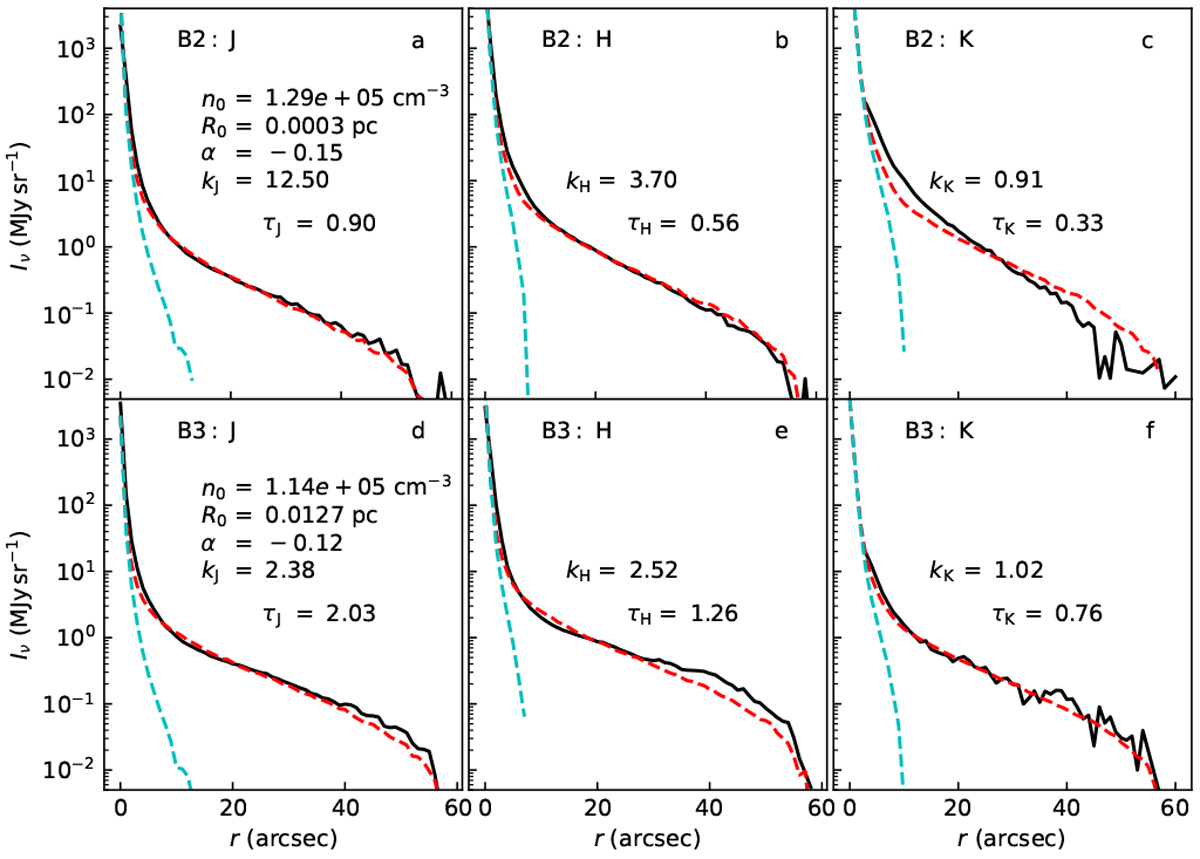
NIR surface brightness profiles in the vicinity of the embedded sources B2 (frames a–c) and B3 (frames d–f). The black curvesshow the azimuthally averaged observed profile. The red dashed curves show the model predictions for J13 dust, consisting of the scattered light and the attenuated direct contribution of the central source. The average signal at 55–60′′ distance is subtracted from both curves. The cyan lines show the estimated direct contribution of the point source, based on the fitted source luminosity, the LOS extinction, and the psf shape.
Current usage metrics show cumulative count of Article Views (full-text article views including HTML views, PDF and ePub downloads, according to the available data) and Abstracts Views on Vision4Press platform.
Data correspond to usage on the plateform after 2015. The current usage metrics is available 48-96 hours after online publication and is updated daily on week days.
Initial download of the metrics may take a while.