Fig. 10
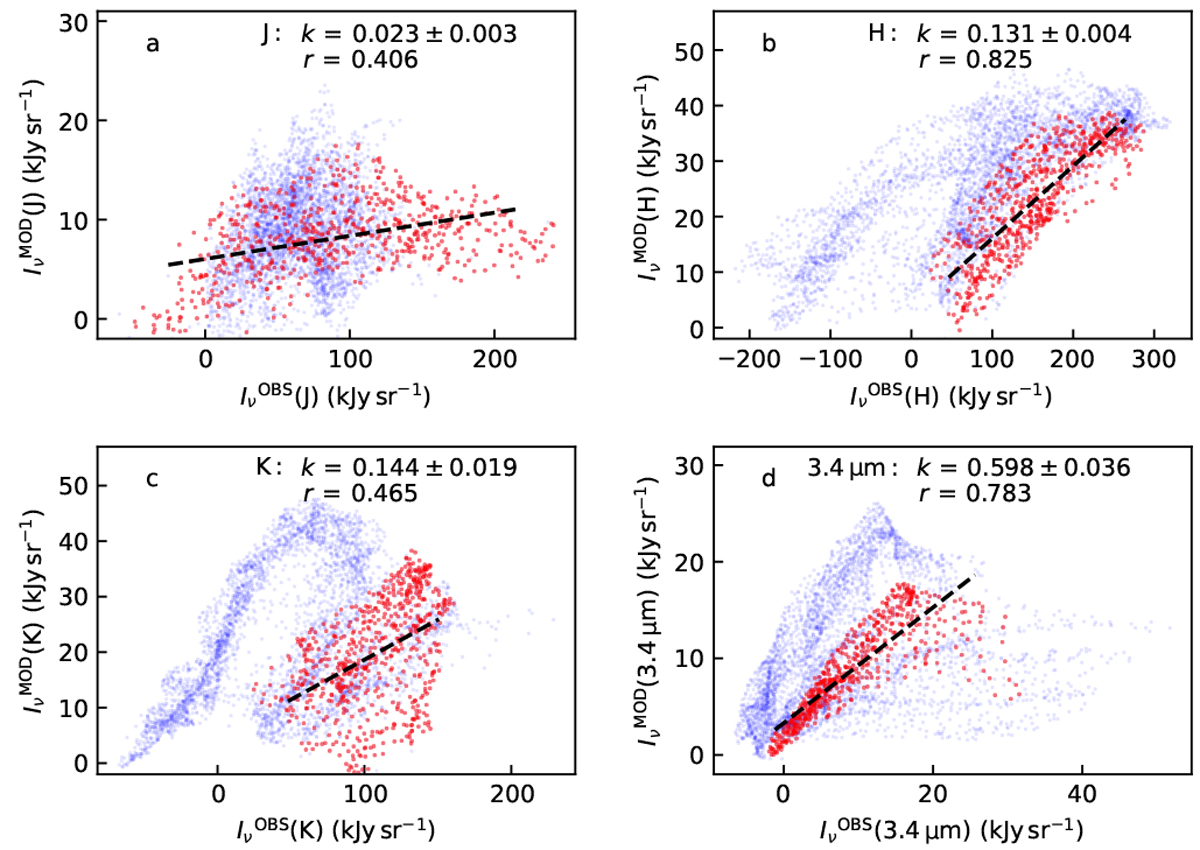
Correlation between the observed and modelled scattered light in the J, H, KS, and 3.4 μm bands. The model results correspond to models where the densities have been scaled down to match the NICER extinction measurements (J13 dust, and W = 1). The data have a resolution of 25′′ resolution and sample at 7′′ steps the areas marked in Fig. 8f. The blue points correspond to the larger area and the red points to the smaller area. The dashed lines show robust least squares fits to the red points. The values of the slopes and correlation coefficients r are given in the frames.
Current usage metrics show cumulative count of Article Views (full-text article views including HTML views, PDF and ePub downloads, according to the available data) and Abstracts Views on Vision4Press platform.
Data correspond to usage on the plateform after 2015. The current usage metrics is available 48-96 hours after online publication and is updated daily on week days.
Initial download of the metrics may take a while.