Fig. 1
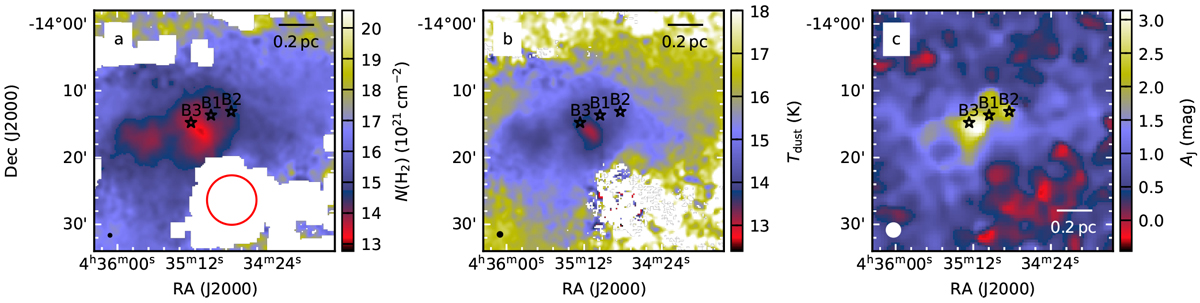
Column density N(H2) (frame a), dust temperature Tdust (frame b), and J-band extinction AJ (frame c) of LDN 1642. The resolution of the maps is indicated by the circles in the lower left corner. The values of N(H2) and Tdust are based on MBB SED fits to Herschel SPIRE data, after background subtraction. The red circle in frame a shows the reference region used for the background estimation. Areas with low column density have been masked in the plots (white pixels). The labelled stars indicate the locations of embedded sources B1–B3.
Current usage metrics show cumulative count of Article Views (full-text article views including HTML views, PDF and ePub downloads, according to the available data) and Abstracts Views on Vision4Press platform.
Data correspond to usage on the plateform after 2015. The current usage metrics is available 48-96 hours after online publication and is updated daily on week days.
Initial download of the metrics may take a while.