Fig. 9
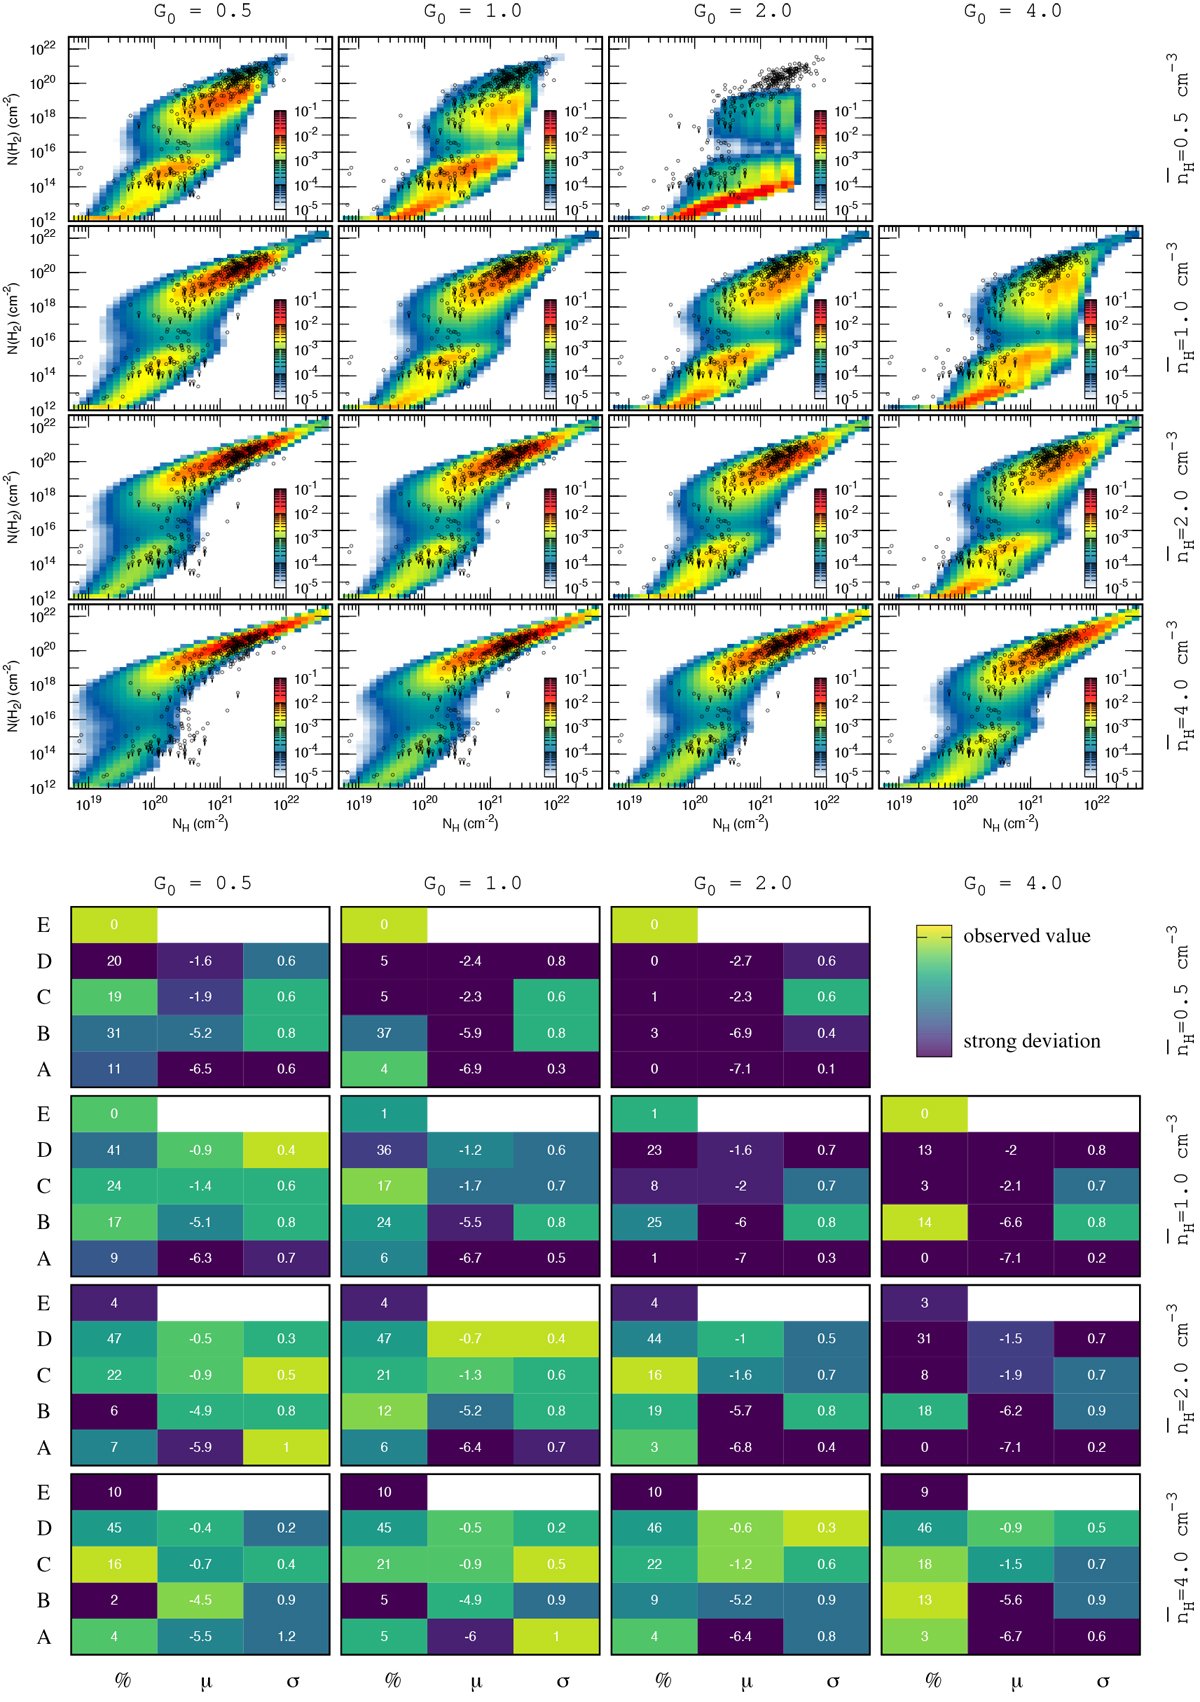
Top frame: comparisons of the observational dataset (black points) with the 2D probability histograms of NH and N(H2) computed from the reconstruction algorithm (see Sect. 3.8) applied to thesimulations. Bottom frame: fraction of lines of sight (%), and mean value μ and dispersion σ of the logarithm of the molecular fraction computed from the simulated histograms in the regions A, B, C, D, and E defined in Table 1. Numbers correspond to the values of %, μ, and σ. The color code indicates a measure of distance (in arbitrary units) between the observed and simulated values in order to guide the eye. These comparisons are shown in each frame for 15 different simulations with G0 varying from 0.5 (left panels) to 4 (right panels) and ![]() varying from0.5 cm−3 (top panels) to 4 cm−3 (bottom panels). All other parameters are set to their fiducial values (see Table 2).
varying from0.5 cm−3 (top panels) to 4 cm−3 (bottom panels). All other parameters are set to their fiducial values (see Table 2).
Current usage metrics show cumulative count of Article Views (full-text article views including HTML views, PDF and ePub downloads, according to the available data) and Abstracts Views on Vision4Press platform.
Data correspond to usage on the plateform after 2015. The current usage metrics is available 48-96 hours after online publication and is updated daily on week days.
Initial download of the metrics may take a while.