Fig. 8
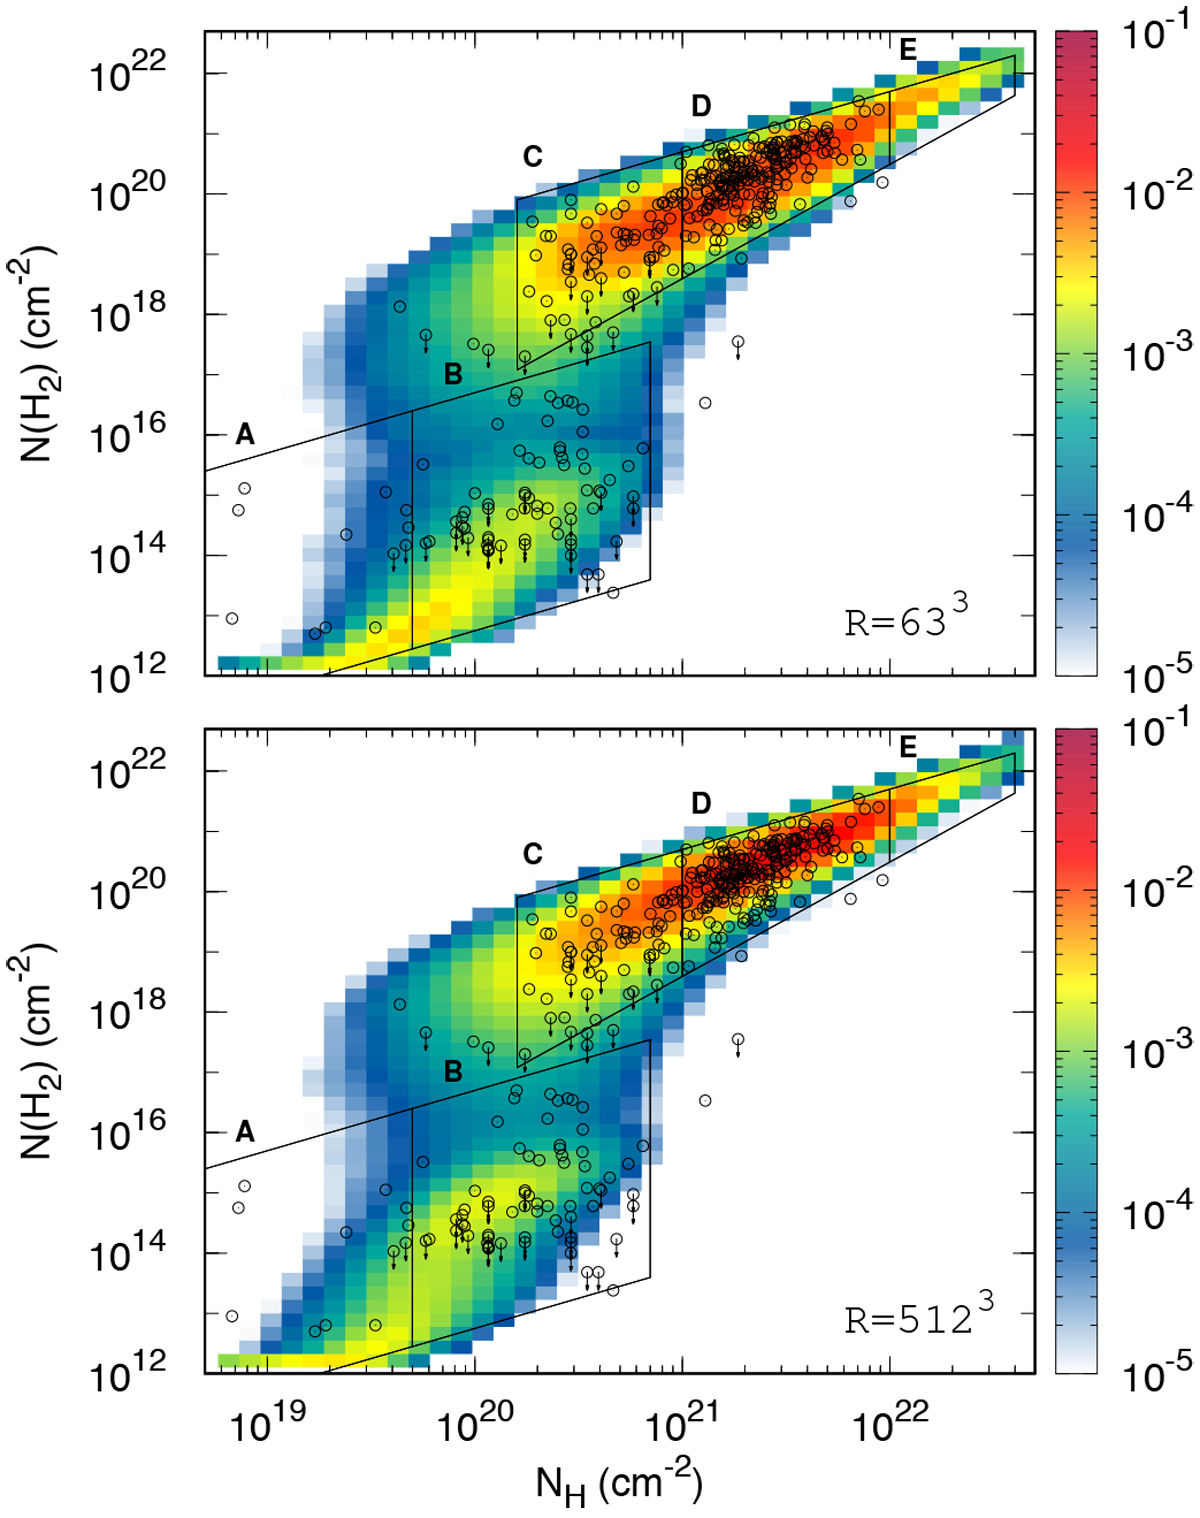
Comparison of the observational dataset (black points) to the 2D probability histogram reconstruction algorithm (see Sect. 3.8) applied to the fiducial simulation (colored histogram). Results are shown for two resolutions, R = 643 (top panel) and R = 5123 (bottom panel). Observations include detections of H2 (circles) and upper limits on N(H2) (arrows). The color code indicates the fraction of lines of sight (in logarithmic scale) contained in each bin. As a reminder, contours of the regions A, B, C, D, and E defined in Sect. 2 (see Table 1) are also displayed.
Current usage metrics show cumulative count of Article Views (full-text article views including HTML views, PDF and ePub downloads, according to the available data) and Abstracts Views on Vision4Press platform.
Data correspond to usage on the plateform after 2015. The current usage metrics is available 48-96 hours after online publication and is updated daily on week days.
Initial download of the metrics may take a while.