Fig. 7
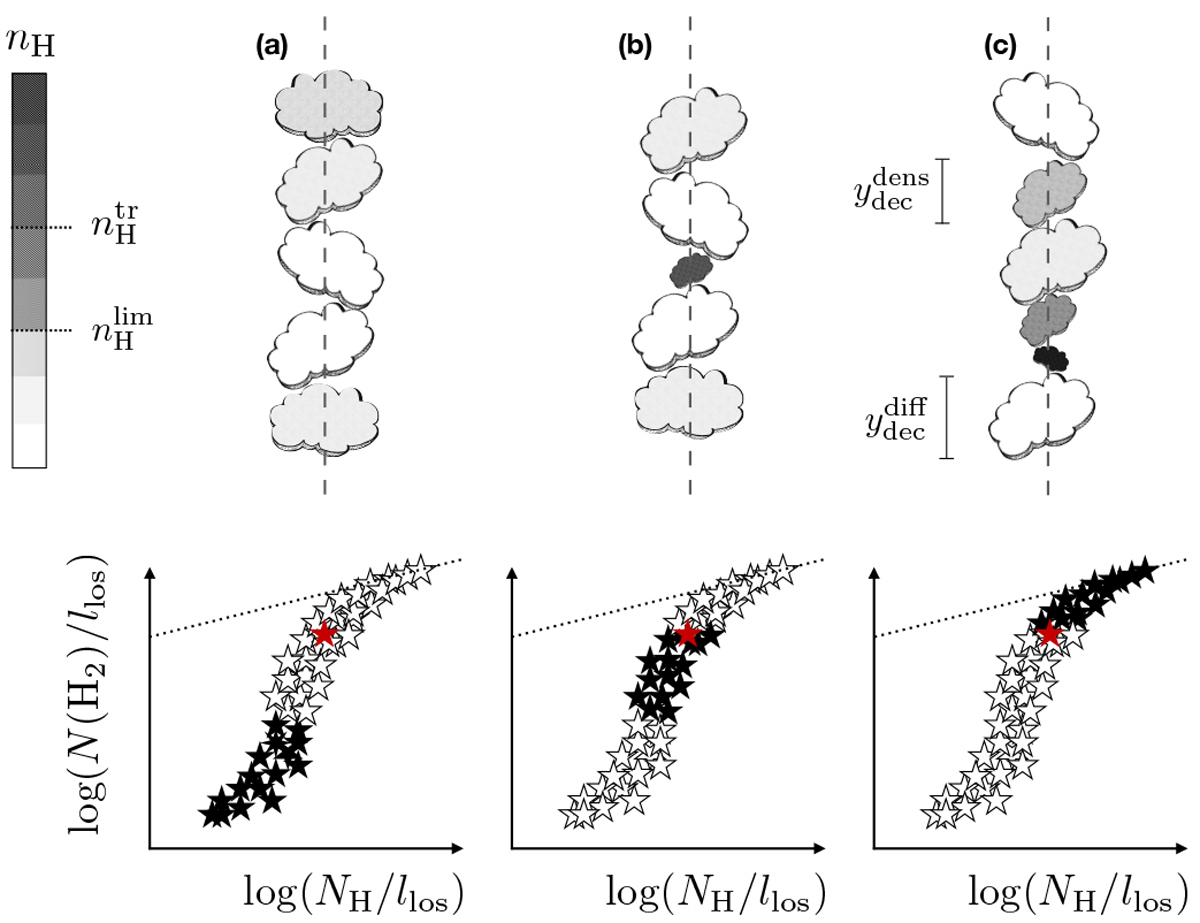
Schematic view of lines of sight of fixed length llos inferred from the analytical model described in Appendix C, and corresponding contributions to the histogram of the normalized column densities NH ∕llos and N(H2)∕llos. Bottom panels: the white stars correspond to all lines of sight while the black stars correspond to the specific cases illustrated above. Any line of sight is intercepting several components of constant density nH. Diffuse components (![]() ) have a size
) have a size ![]() ; dense components (
; dense components (![]() ) have a distribution of sizes
) have a distribution of sizes ![]() . Only components with densities larger than
. Only components with densities larger than ![]() are molecular (see main text). The red star in the bottom panels indicates the mean value of NH ∕llos and N(H2)∕llos computed over a large sample of lines of sight (white stars), hence the expected mean molecular fraction. The dotted line indicates a fully molecular medium.
are molecular (see main text). The red star in the bottom panels indicates the mean value of NH ∕llos and N(H2)∕llos computed over a large sample of lines of sight (white stars), hence the expected mean molecular fraction. The dotted line indicates a fully molecular medium.
Current usage metrics show cumulative count of Article Views (full-text article views including HTML views, PDF and ePub downloads, according to the available data) and Abstracts Views on Vision4Press platform.
Data correspond to usage on the plateform after 2015. The current usage metrics is available 48-96 hours after online publication and is updated daily on week days.
Initial download of the metrics may take a while.