Fig. 6
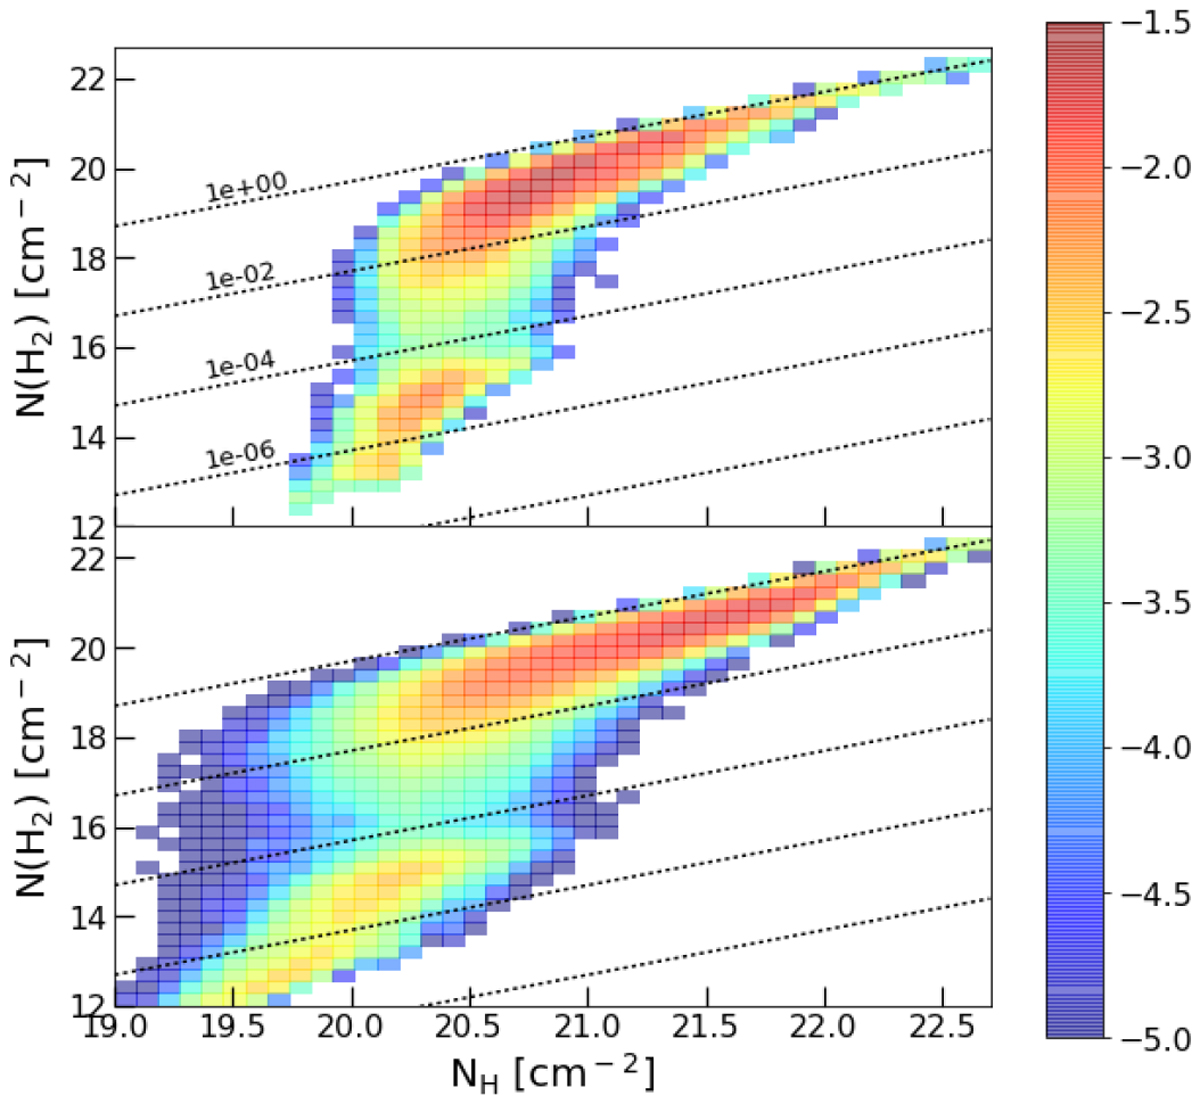
2D probability histogram of the total proton column density NH and the column density of molecular hydrogen N(H2) obtained with the standard simulation (see Table 2). Upper panel: original data where all lines of sight have a size L= 200 pc. Bottom panel: outcome of the reconstruction algorithm described in Sect. 3.8 that produces a sample of lines of sight ranging from 100 to 3200 pc. The color code indicates the fraction of lines of sight (in logarithmic scale) contained in each bin. Dotted lines are isocontours of the molecular fraction for
![]() ,
10−6, 10−4, 10−2, and 1.
,
10−6, 10−4, 10−2, and 1.
Current usage metrics show cumulative count of Article Views (full-text article views including HTML views, PDF and ePub downloads, according to the available data) and Abstracts Views on Vision4Press platform.
Data correspond to usage on the plateform after 2015. The current usage metrics is available 48-96 hours after online publication and is updated daily on week days.
Initial download of the metrics may take a while.