Fig. 4
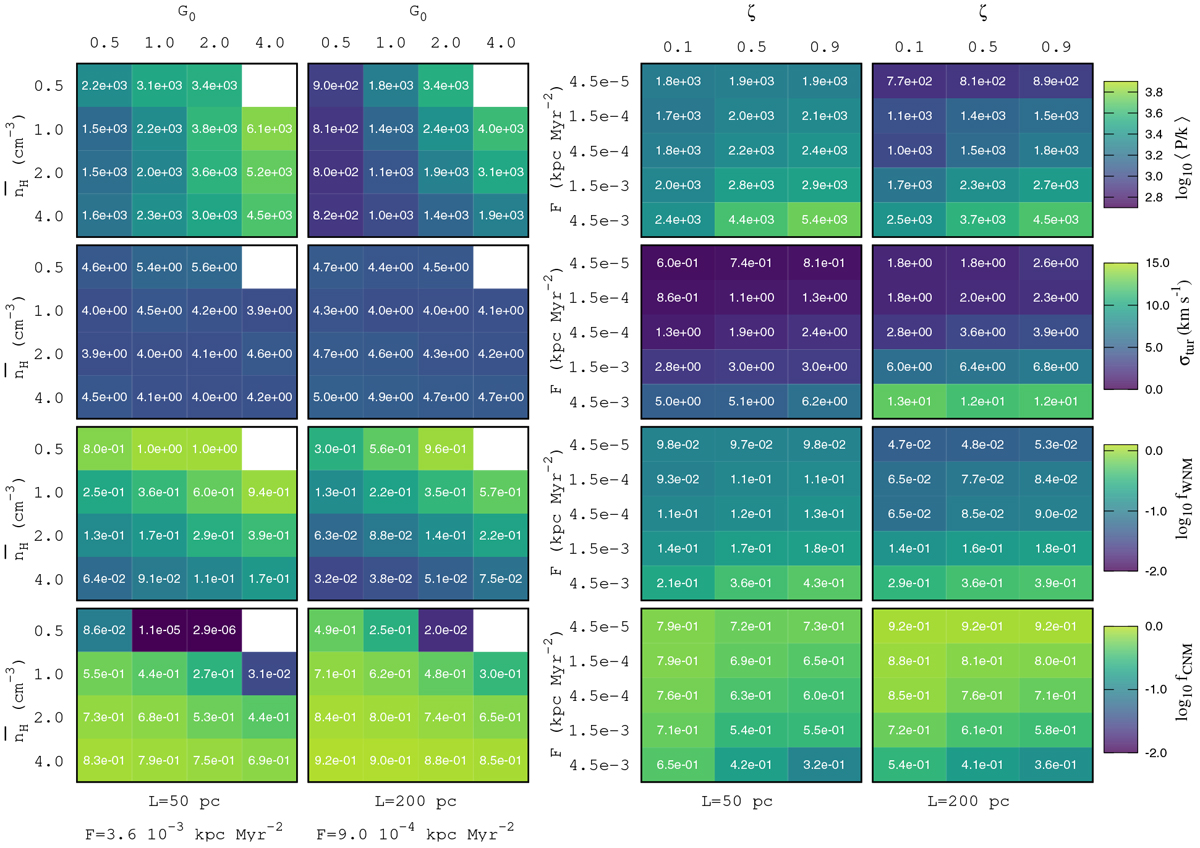
Colored tables of the mean pressure expressed in K cm−3 (first line), the turbulent velocity dispersion σtur (second line), and the fractions of mass fWNM and fCNM contained inthe WNM phase (third line) and the CNM phase (fourth line). First and second columns: these quantities as functions of ![]() and G0, for L = 50 pc and F = 3.6 × 10⁻³ kpc Myr−2 (first column) and for L = 200 pc and F = 9 × 10⁻⁴ kpc Myr−2 (second column). Third and fourth columns: these quantities as functions of the acceleration parameter F and the compressive ratio ζ, for L = 50 pc (third column) and L = 200 pc (fourth column). All other parameters are set to their standard values (see Table 2).
and G0, for L = 50 pc and F = 3.6 × 10⁻³ kpc Myr−2 (first column) and for L = 200 pc and F = 9 × 10⁻⁴ kpc Myr−2 (second column). Third and fourth columns: these quantities as functions of the acceleration parameter F and the compressive ratio ζ, for L = 50 pc (third column) and L = 200 pc (fourth column). All other parameters are set to their standard values (see Table 2).
Current usage metrics show cumulative count of Article Views (full-text article views including HTML views, PDF and ePub downloads, according to the available data) and Abstracts Views on Vision4Press platform.
Data correspond to usage on the plateform after 2015. The current usage metrics is available 48-96 hours after online publication and is updated daily on week days.
Initial download of the metrics may take a while.