Fig. 3
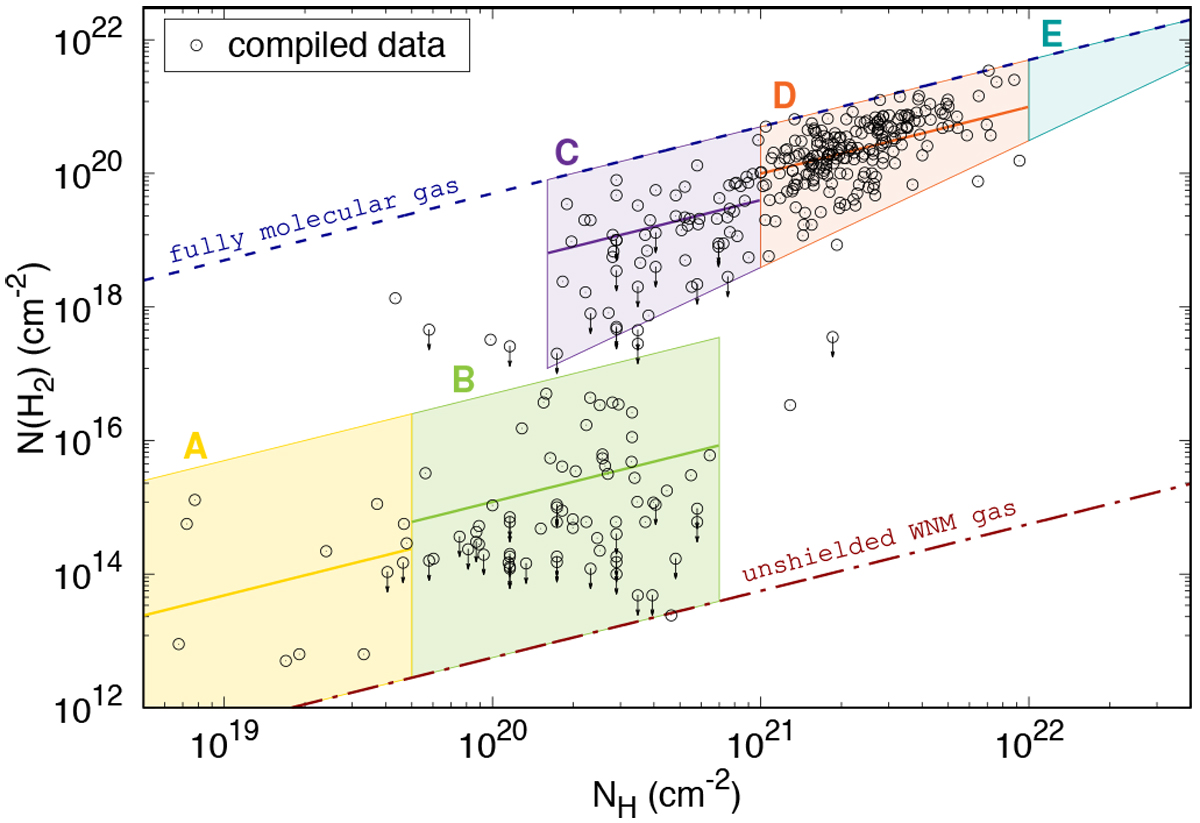
H2 column density as a function of the total column density of protons NH. Open circles correspond to detections of H2 while arrows correspond to upper limits (see Table A.1). The blue dashed line indicates the maximum value of N(H2) derived from a purely molecular medium with an integrated molecular fraction
![]() (Eq. (2)). The red dashed-dotted line indicates the theoretical molecular fraction derived in an unshielded WNM-type environment with a density of 0.5 cm−3 and a temperature of 8000 K, illuminated by a UV photon flux of 108 cm−2 s−1
(see Eqs. (13) and (15)). The regions A, B, C, D, and E defined in Table 1
correspond to an arbitrary separation of the observational sample used for quantitative comparisons with the results of simulations (see Sect. 4).
(Eq. (2)). The red dashed-dotted line indicates the theoretical molecular fraction derived in an unshielded WNM-type environment with a density of 0.5 cm−3 and a temperature of 8000 K, illuminated by a UV photon flux of 108 cm−2 s−1
(see Eqs. (13) and (15)). The regions A, B, C, D, and E defined in Table 1
correspond to an arbitrary separation of the observational sample used for quantitative comparisons with the results of simulations (see Sect. 4).
Current usage metrics show cumulative count of Article Views (full-text article views including HTML views, PDF and ePub downloads, according to the available data) and Abstracts Views on Vision4Press platform.
Data correspond to usage on the plateform after 2015. The current usage metrics is available 48-96 hours after online publication and is updated daily on week days.
Initial download of the metrics may take a while.