Fig. D.2
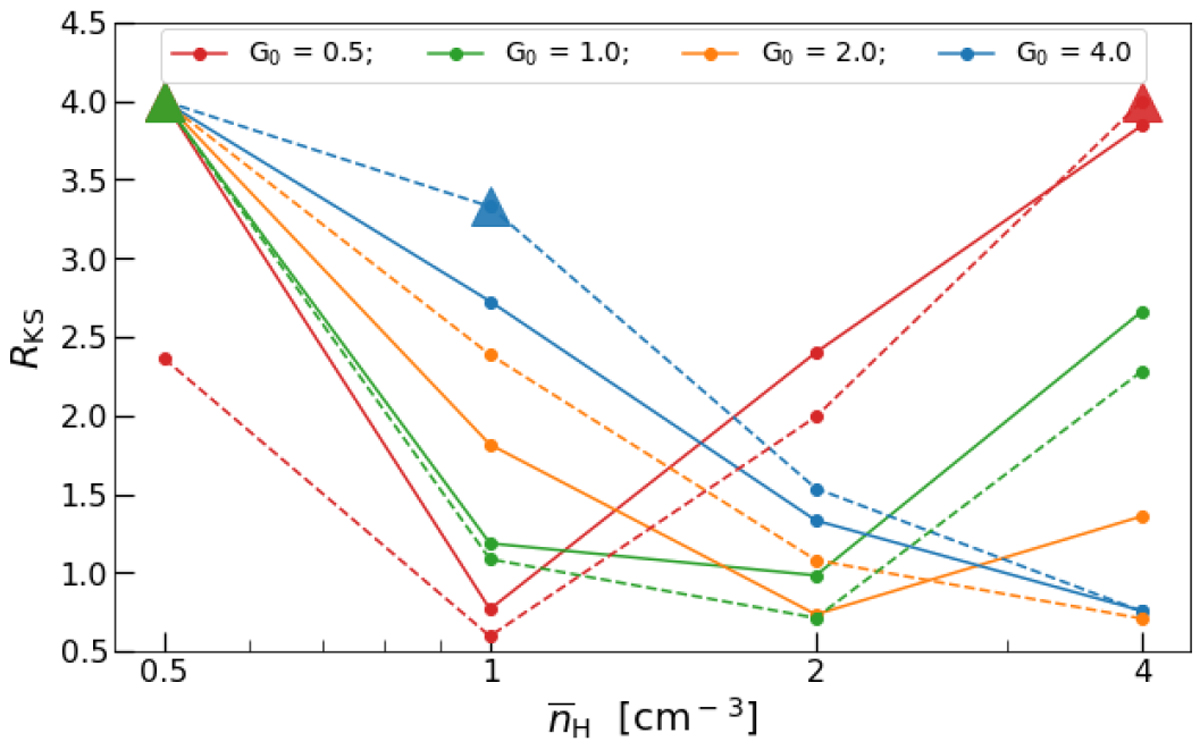
KSdistance between the simulations and the observational sample as a function of the mean density
![]() , the UV scaling factor G0 = 0.5 (red), 1 (green), 2 (orange), and 4 (blue), and for a resolution of 2563
(solid lines) and 1283
(dashed lines). All other parameters are set to their standard values (see Table 2). Points correspond to reliable measurements of the KS distances. Triangles indicate lower limits corresponding to simulations where the upper error bar on
RKS tends toward infinity (see main text).
, the UV scaling factor G0 = 0.5 (red), 1 (green), 2 (orange), and 4 (blue), and for a resolution of 2563
(solid lines) and 1283
(dashed lines). All other parameters are set to their standard values (see Table 2). Points correspond to reliable measurements of the KS distances. Triangles indicate lower limits corresponding to simulations where the upper error bar on
RKS tends toward infinity (see main text).
Current usage metrics show cumulative count of Article Views (full-text article views including HTML views, PDF and ePub downloads, according to the available data) and Abstracts Views on Vision4Press platform.
Data correspond to usage on the plateform after 2015. The current usage metrics is available 48-96 hours after online publication and is updated daily on week days.
Initial download of the metrics may take a while.