Open Access
Fig. 2
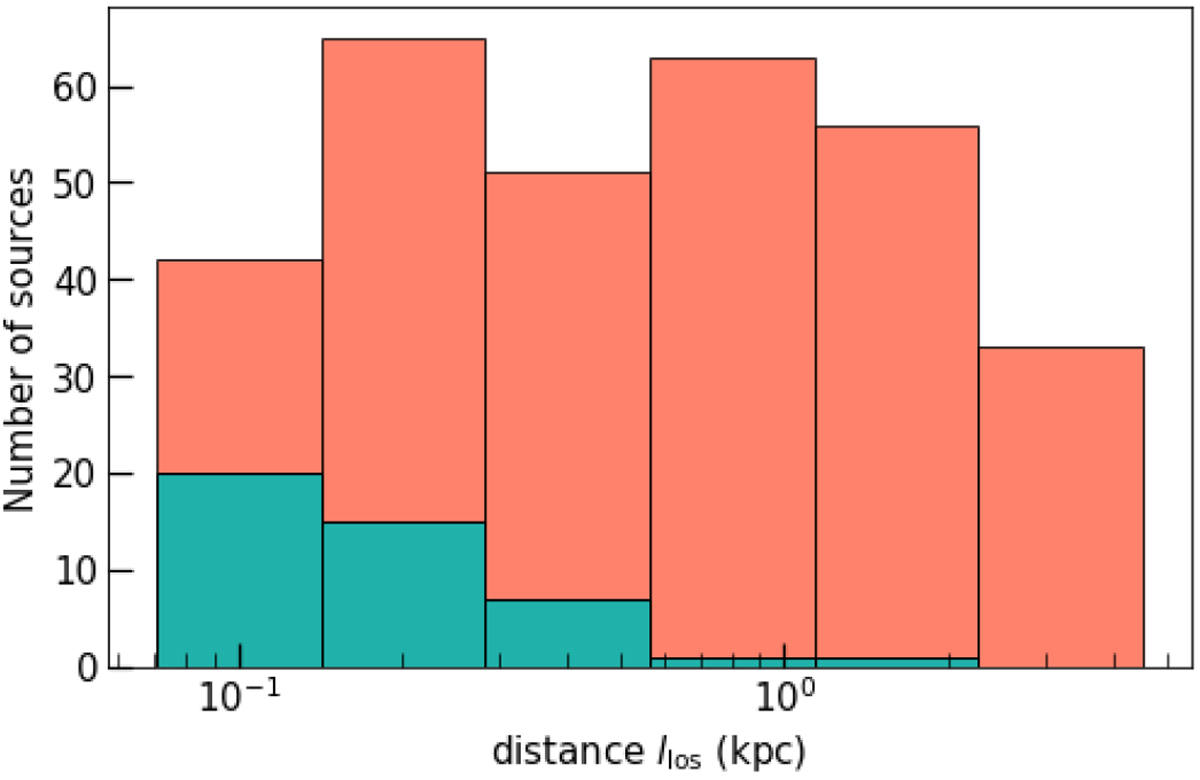
Distribution of lengths llos of the intercepted diffuse material computed with Eq. (1) along all lines of sight of the observational sample. The orange sample corresponds to lines of sight where H2 is detected and the green sample to those for which an upper limit on N(H2) has been derived (see Table A.1).
Current usage metrics show cumulative count of Article Views (full-text article views including HTML views, PDF and ePub downloads, according to the available data) and Abstracts Views on Vision4Press platform.
Data correspond to usage on the plateform after 2015. The current usage metrics is available 48-96 hours after online publication and is updated daily on week days.
Initial download of the metrics may take a while.