Fig. D.1
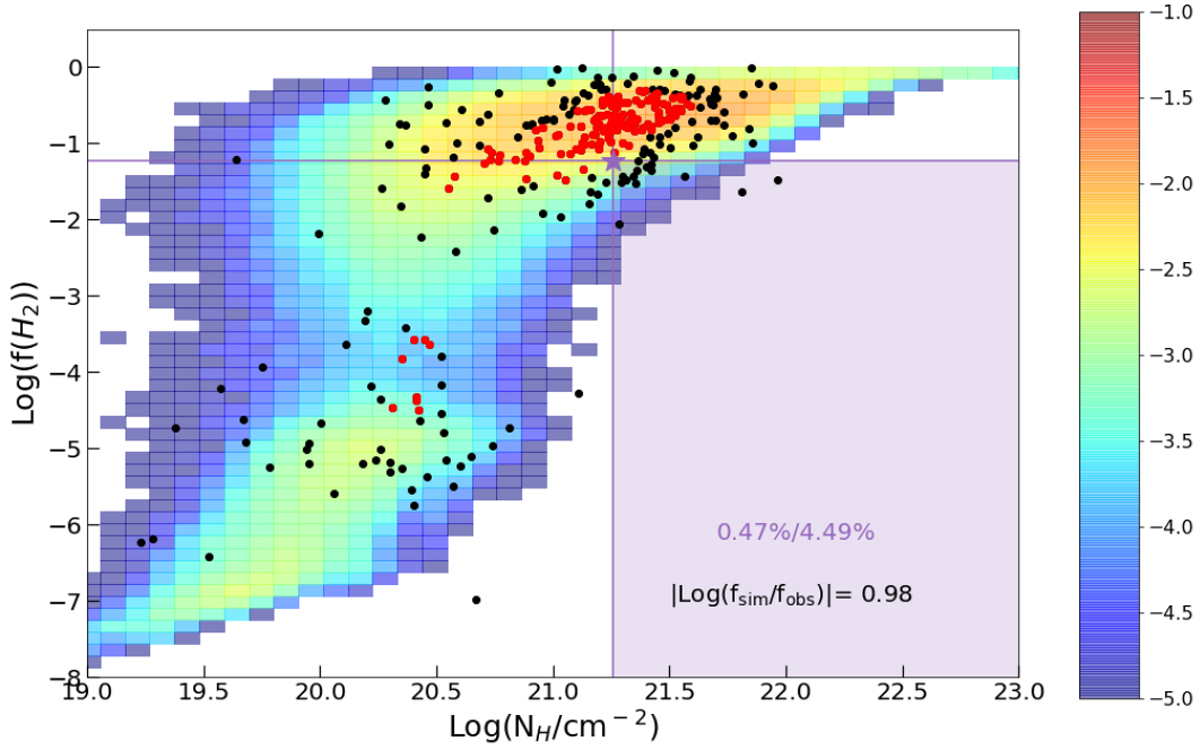
Results of the modified KS test applied to the fiducial simulation. The black points are the observational data, the red dots indicate the dataset used for the estimations of the merit function M, and the 2D histogram the simulated data. The violet star and rectangle indicate the observational point and the quadrant that maximize M (see main text). The fiducial simulation has a KS distance of 0.98. The corresponding quadrant contains 0.47 and 4.49% of the entiresimulated and observed datasets.
Current usage metrics show cumulative count of Article Views (full-text article views including HTML views, PDF and ePub downloads, according to the available data) and Abstracts Views on Vision4Press platform.
Data correspond to usage on the plateform after 2015. The current usage metrics is available 48-96 hours after online publication and is updated daily on week days.
Initial download of the metrics may take a while.