Open Access
Fig. C.4
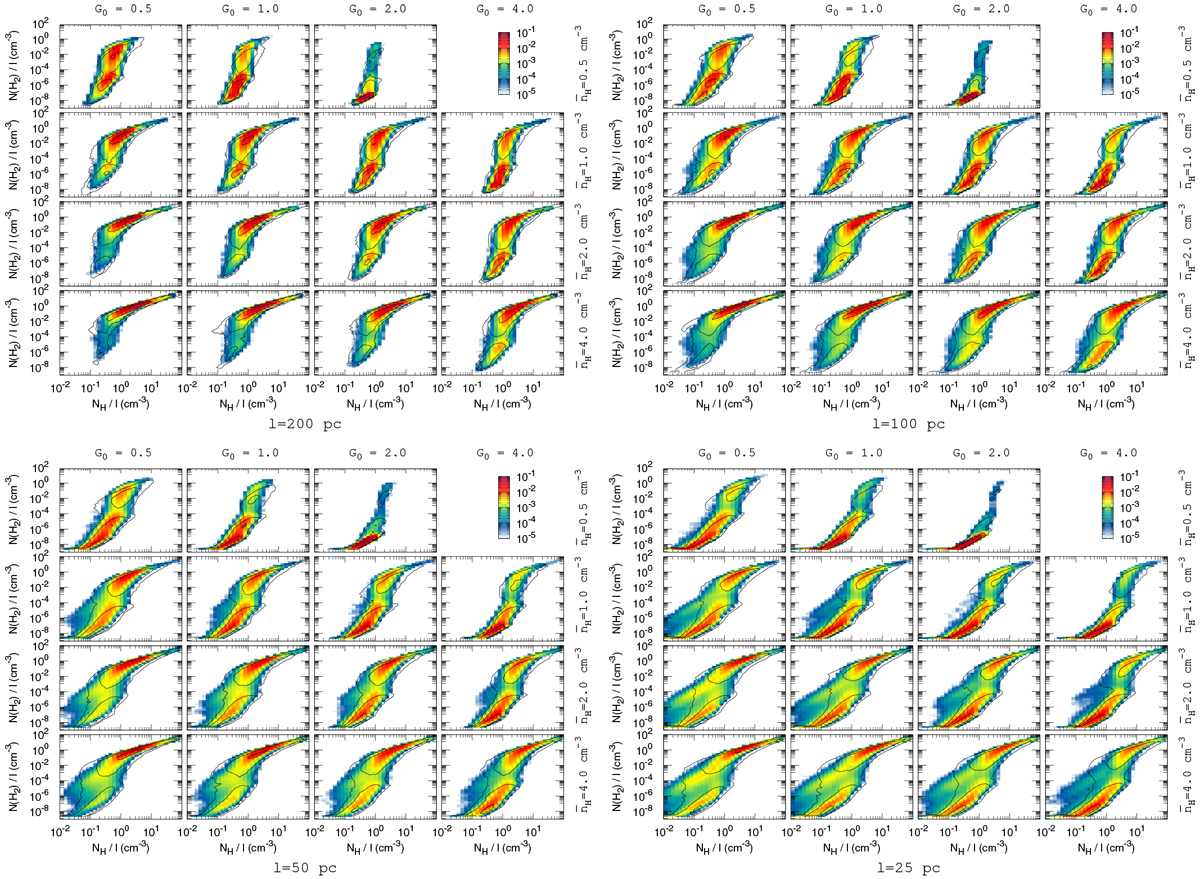
Same as Fig. C.3, assuming that ![]() pc. The exponent used here corresponds to a simple test to show the effect of a dense decorrelation scale
pc. The exponent used here corresponds to a simple test to show the effect of a dense decorrelation scale
![]() varying with density.
varying with density.
Current usage metrics show cumulative count of Article Views (full-text article views including HTML views, PDF and ePub downloads, according to the available data) and Abstracts Views on Vision4Press platform.
Data correspond to usage on the plateform after 2015. The current usage metrics is available 48-96 hours after online publication and is updated daily on week days.
Initial download of the metrics may take a while.