Fig. C.2
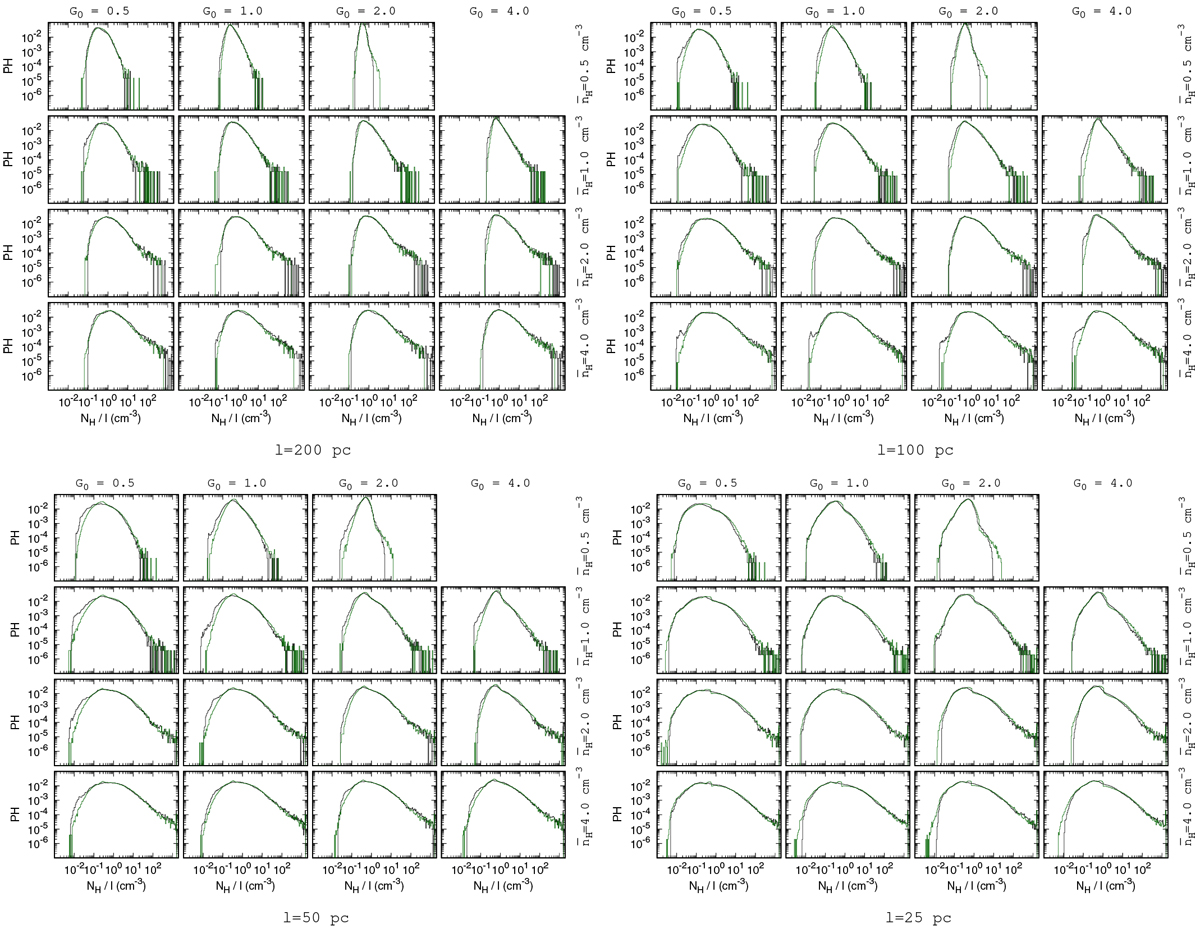
Comparisons of the 1D probability histograms of the total column density normalized to the integration scale, NH ∕l, extracted from the simulations (black histograms) and constructed with the semi-analytical model described in the main text (green histograms) for l = 200 (top left), 100 (top right), 50 (bottom left), and 25 (bottom right) pc. Each of these four main panels displays the comparisons performed for 15 simulations with different
![]() and G0
around the fiducial setup defined by
and G0
around the fiducial setup defined by ![]() cm−3 and G0 = 1. All probability histograms inferred from the semi-analytical model are obtained assuming a fixed correlation length of the diffuse component
cm−3 and G0 = 1. All probability histograms inferred from the semi-analytical model are obtained assuming a fixed correlation length of the diffuse component ![]() pc and a correlation length of the dense component
pc and a correlation length of the dense component ![]() pc (see main text).
pc (see main text).
Current usage metrics show cumulative count of Article Views (full-text article views including HTML views, PDF and ePub downloads, according to the available data) and Abstracts Views on Vision4Press platform.
Data correspond to usage on the plateform after 2015. The current usage metrics is available 48-96 hours after online publication and is updated daily on week days.
Initial download of the metrics may take a while.