Fig. 12
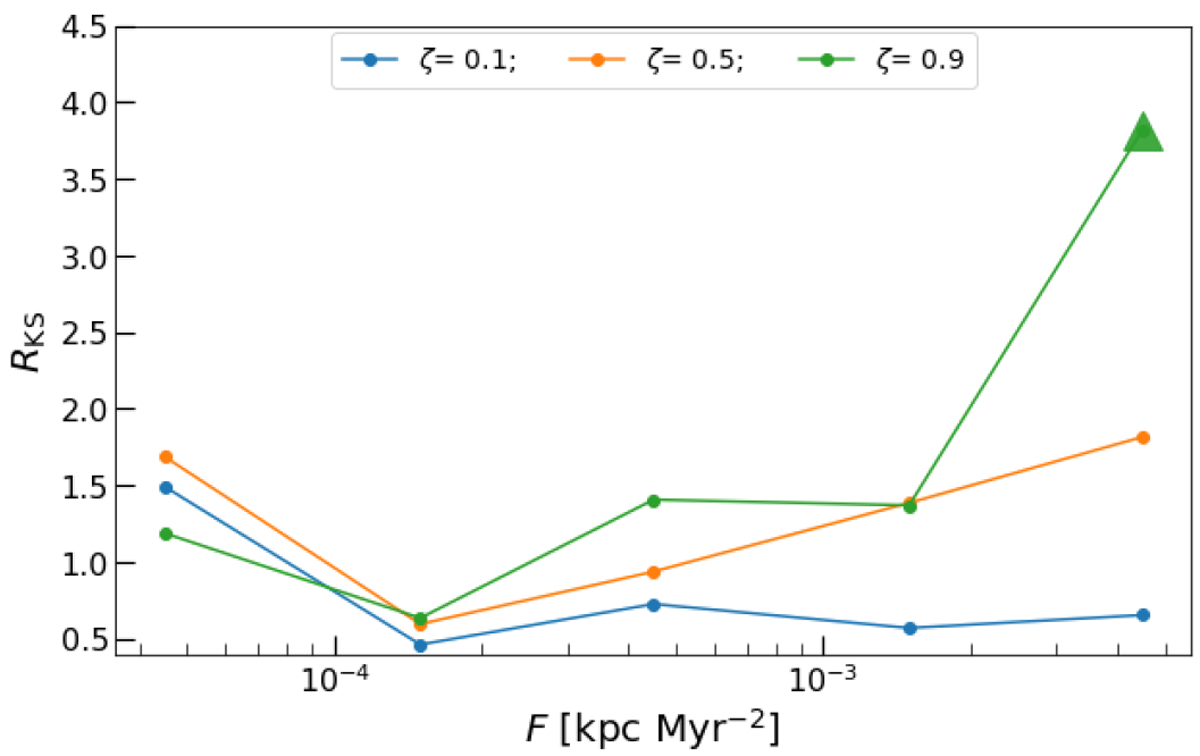
KS distances between the simulations and the observational sample computed for five values of the acceleration parameter F = 4.5 × 10⁻⁵, 1.5 × 10⁻⁴, 4.5 × 10⁻⁴, 1.5 × 10⁻³, and 4.5 × 10⁻³ kpc Myr−2, and three values of the compressive ratio ζ = 0.1 (blue points), 0.5 (orange points), and 0.9 (green points), which set the balance between compressive and solenoidal forcing (see Sect. 3.3). All other parameters are set to their standard values (see Table 2). Points correspond to reliable measurements of the KS distances. The triangle indicates a lower limit corresponding to a simulation where the upper error bar on RKS tends toward infinity (see Appendix D).
Current usage metrics show cumulative count of Article Views (full-text article views including HTML views, PDF and ePub downloads, according to the available data) and Abstracts Views on Vision4Press platform.
Data correspond to usage on the plateform after 2015. The current usage metrics is available 48-96 hours after online publication and is updated daily on week days.
Initial download of the metrics may take a while.