Fig. 8
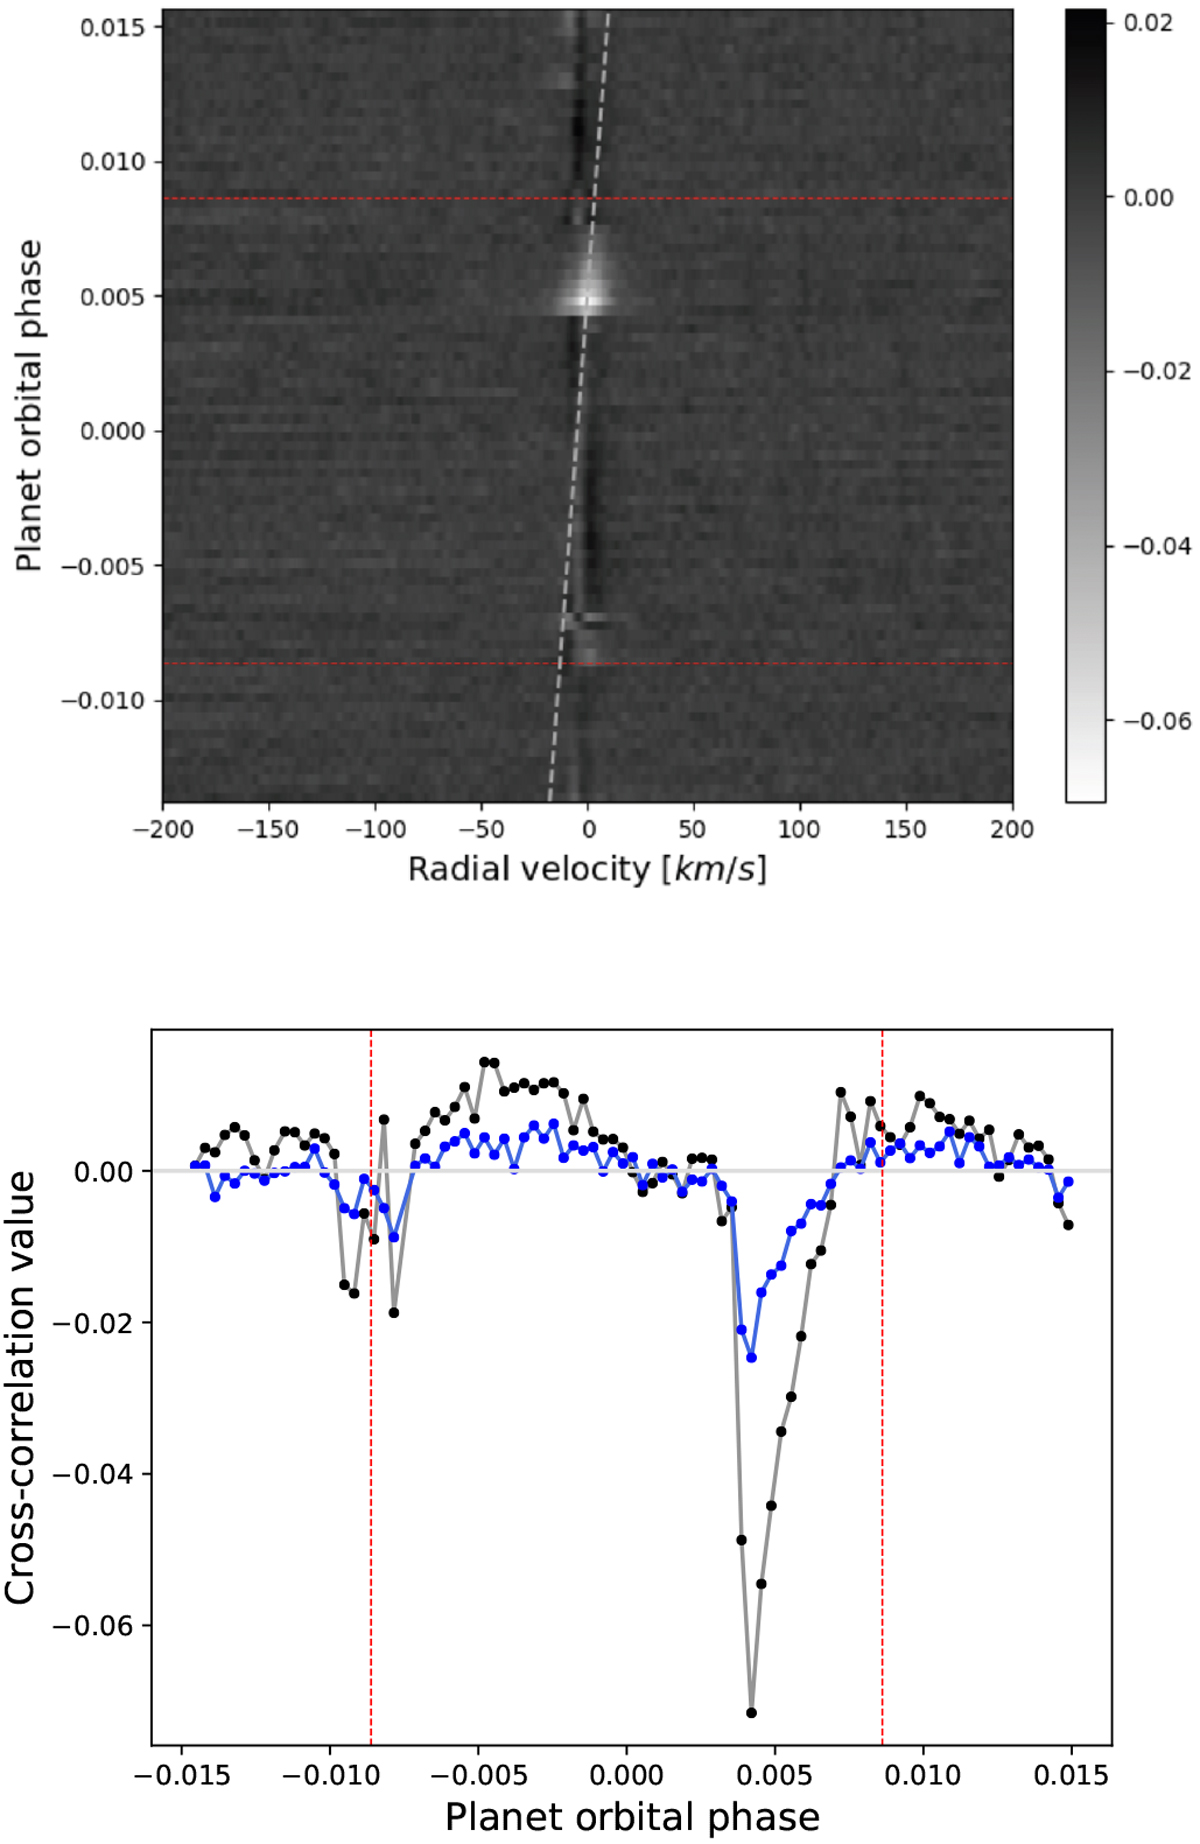
Top: cross-correlation residuals map of FeI during the observations. The horizontal red-dashed lines show first (T1) and last (T4) transit contacts and the white-dashed lines show the expected planetary trail. Bottom: cross-correlation values at 0 km s−1 vs. time for Fe I (black), that is, a vertical cut on the top panel. Also shown is the cross-correlation evolution but for the Ca I (blue), showing a similar time evolution.
Current usage metrics show cumulative count of Article Views (full-text article views including HTML views, PDF and ePub downloads, according to the available data) and Abstracts Views on Vision4Press platform.
Data correspond to usage on the plateform after 2015. The current usage metrics is available 48-96 hours after online publication and is updated daily on week days.
Initial download of the metrics may take a while.