Fig. 4
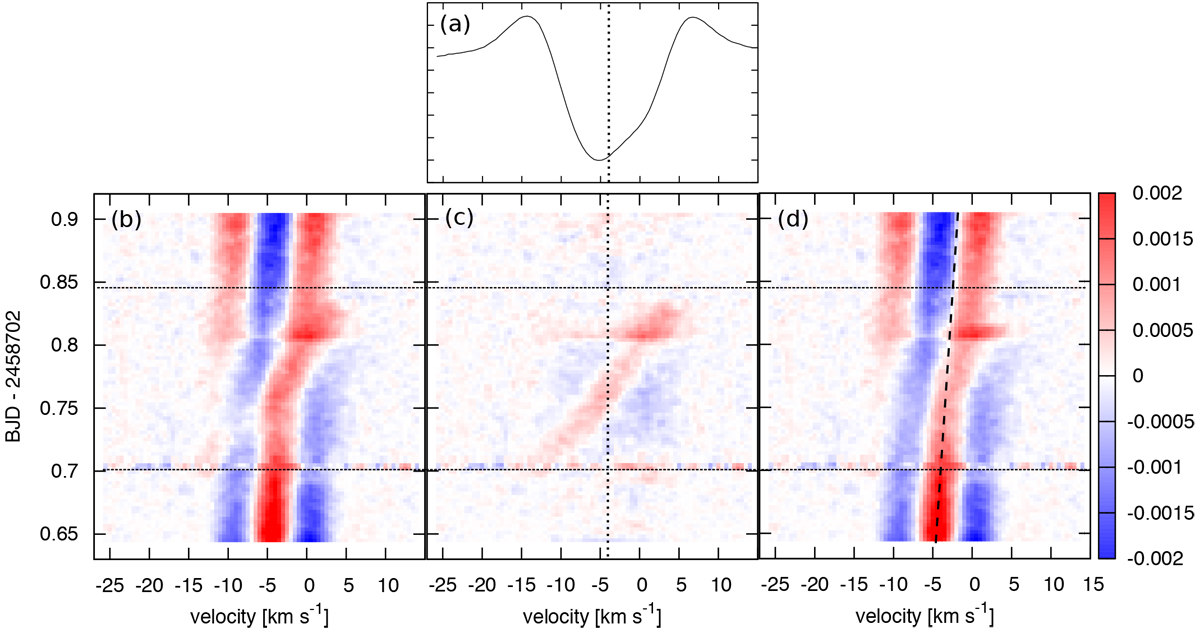
Sample CCF profile during the night (panel a) and the residual (differential) CCF maps as a function of time (panels b–d). Panel b: illustrates the original residual CCF map after subtracting the mean out-of-transit CCF. The low-frequency modulations were subtracted based on the out-of-transit variations in panel c, in which the planet shadow is clearly seen. Panel d: residual map after the observed planet shadow is removed. The vertical dotted lines in panels a and c are the approximate CCF centre, representing the systemic RV of AU Mic. The near-vertical dashed linein panel d draws the maximum shift of the CCF bump by a spot-like feature on the stellar surface (≈ 3 km s−1 over 0.25 day).
Current usage metrics show cumulative count of Article Views (full-text article views including HTML views, PDF and ePub downloads, according to the available data) and Abstracts Views on Vision4Press platform.
Data correspond to usage on the plateform after 2015. The current usage metrics is available 48-96 hours after online publication and is updated daily on week days.
Initial download of the metrics may take a while.