Fig. 3
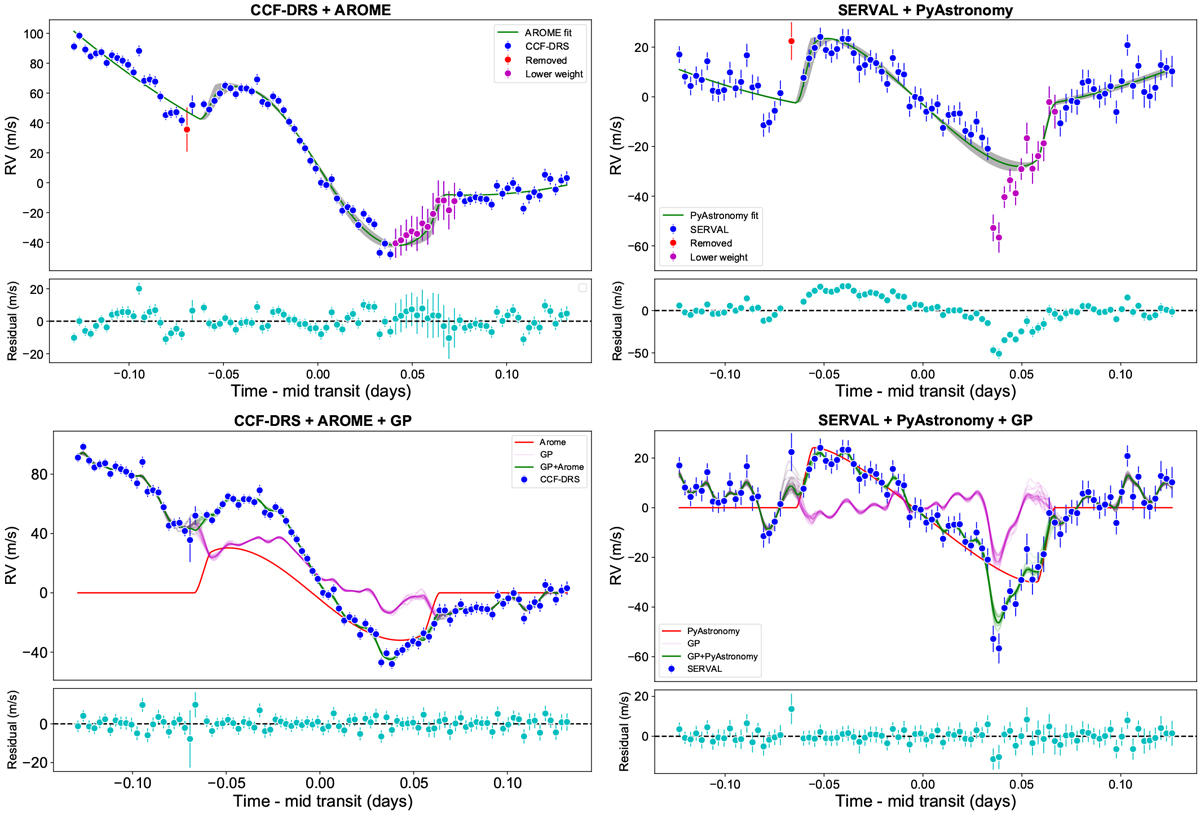
Radial velocity time series derived from the DRS software (left columns) and SERVAL (right columns). Top panels: the best fit model to the RM is shown using the ARoME and PyAstronomy models, respectively. The red point is discarded in our analysis due to an anomalously low S/N, while the magenta points are given a lower weight in the RM fits due to being affected by a stellar flare. Lower panels: the data are the same but the fits incorporate the GP modelling. The different components of each best fit model are plotted in different colors and marked in the legend.
Current usage metrics show cumulative count of Article Views (full-text article views including HTML views, PDF and ePub downloads, according to the available data) and Abstracts Views on Vision4Press platform.
Data correspond to usage on the plateform after 2015. The current usage metrics is available 48-96 hours after online publication and is updated daily on week days.
Initial download of the metrics may take a while.