Fig. 2
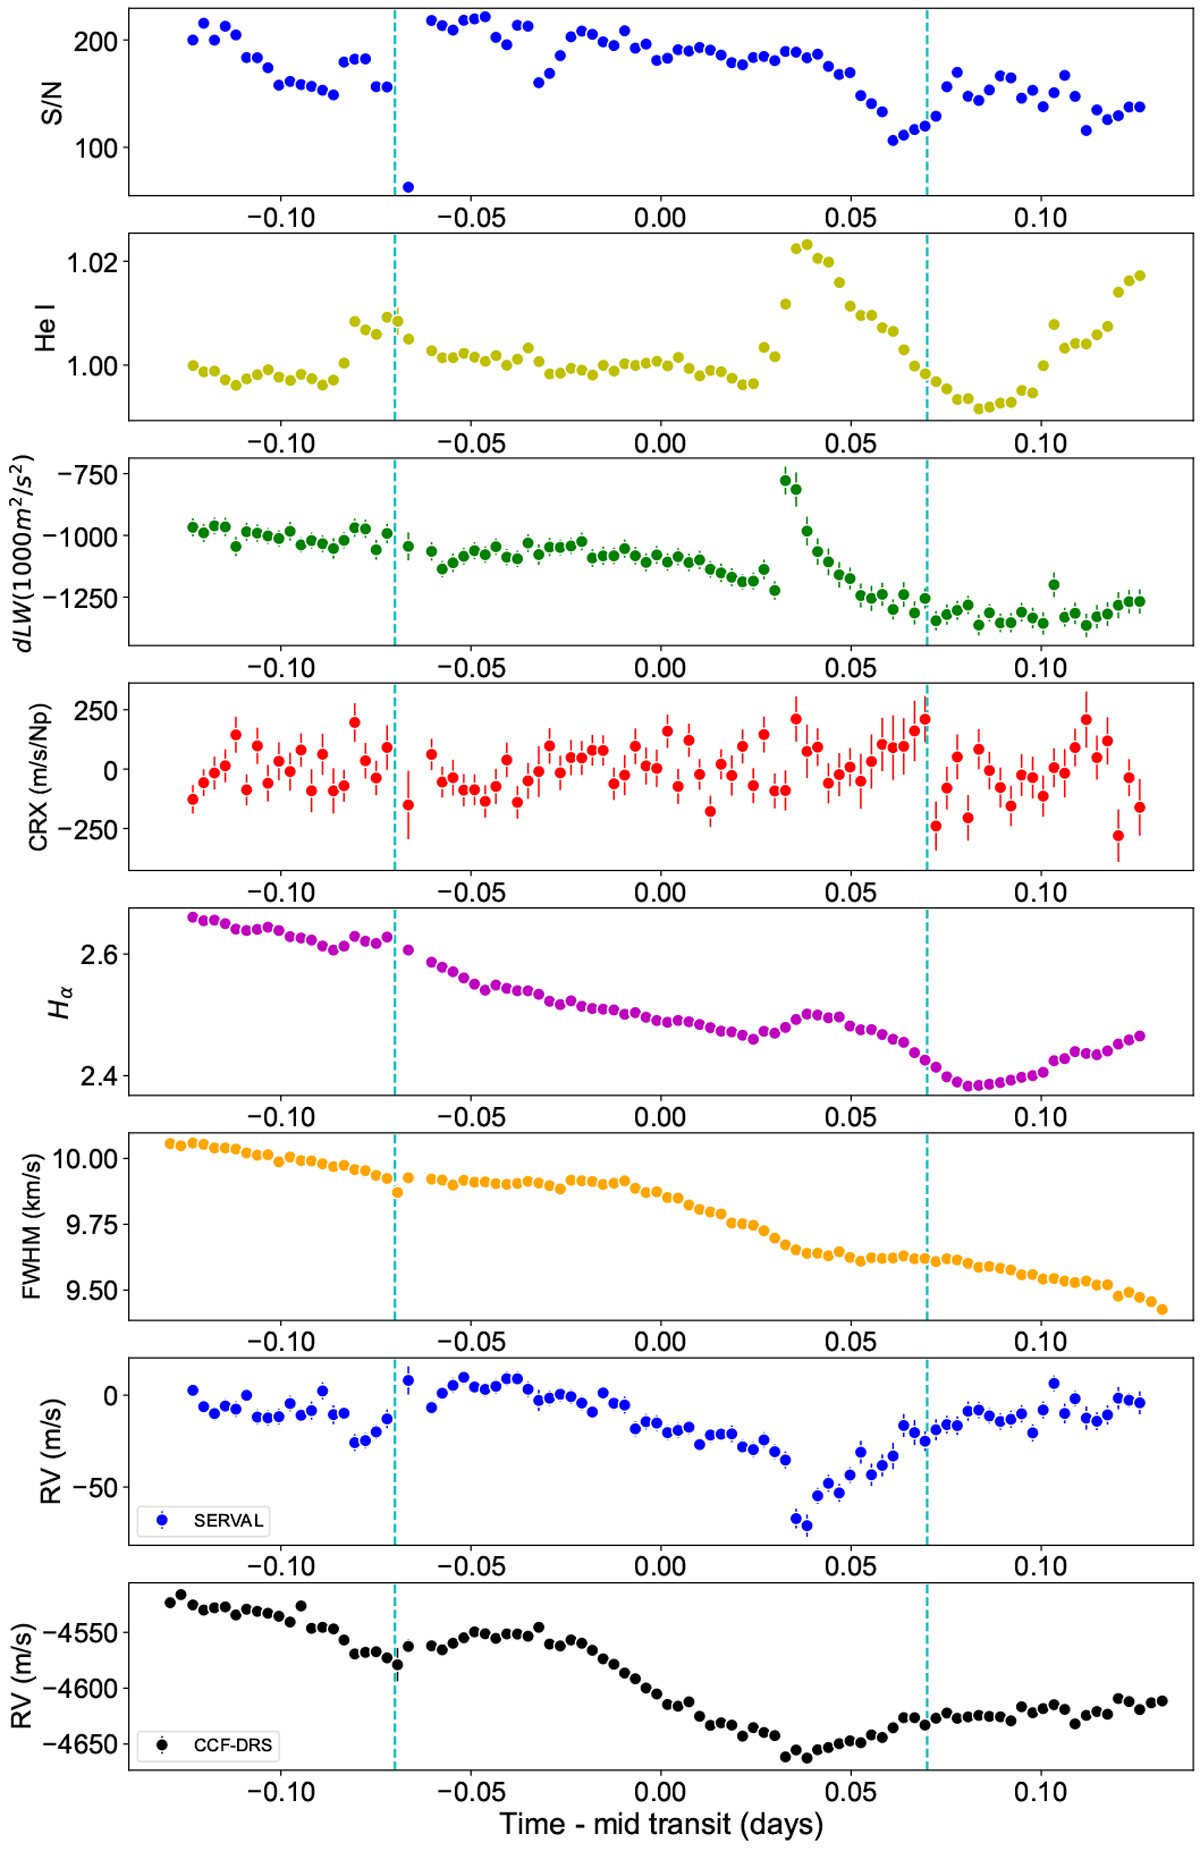
From top to bottom: S/N of each of the individual spectra per pixel; the light curve of the chromospheric He I line at 5877.2 Å. The spectral line was integrated over a spectral range of 1.5 Å-wide; the dLW and CRX indices were derived using SERVAL; the light curve of the Hα line; the FWHM of CCF as estimated from DRS; the radial velocities were derived from SERVAL; and the radial velocities were derived from DRS. The vertical dashed cyan lines mark the predicted ingress and egress of transit of AU Mic b.
Current usage metrics show cumulative count of Article Views (full-text article views including HTML views, PDF and ePub downloads, according to the available data) and Abstracts Views on Vision4Press platform.
Data correspond to usage on the plateform after 2015. The current usage metrics is available 48-96 hours after online publication and is updated daily on week days.
Initial download of the metrics may take a while.