Fig. 1
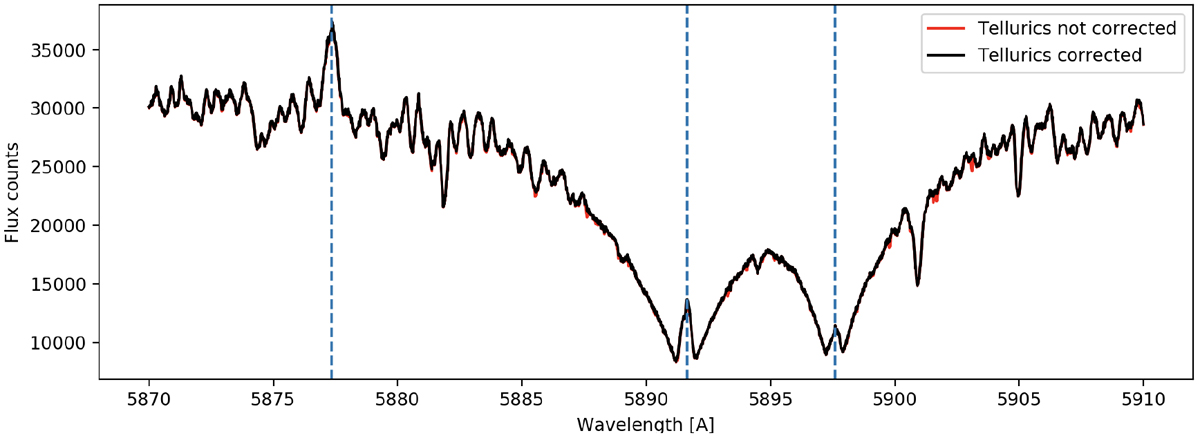
Out-of-transit spectrum of AU Mic, zooming on the spectral region containing the Na I doublet at 5891.7 and 5897.6 Å, and the He I line at 5877.2 Å. The dashed lines indicate the central positions of these three lines. The red spectrum is the raw spectrum after DRS data subtraction, and the black spectrum results after the Molecfit telluric correction.
Current usage metrics show cumulative count of Article Views (full-text article views including HTML views, PDF and ePub downloads, according to the available data) and Abstracts Views on Vision4Press platform.
Data correspond to usage on the plateform after 2015. The current usage metrics is available 48-96 hours after online publication and is updated daily on week days.
Initial download of the metrics may take a while.