Fig. 5.
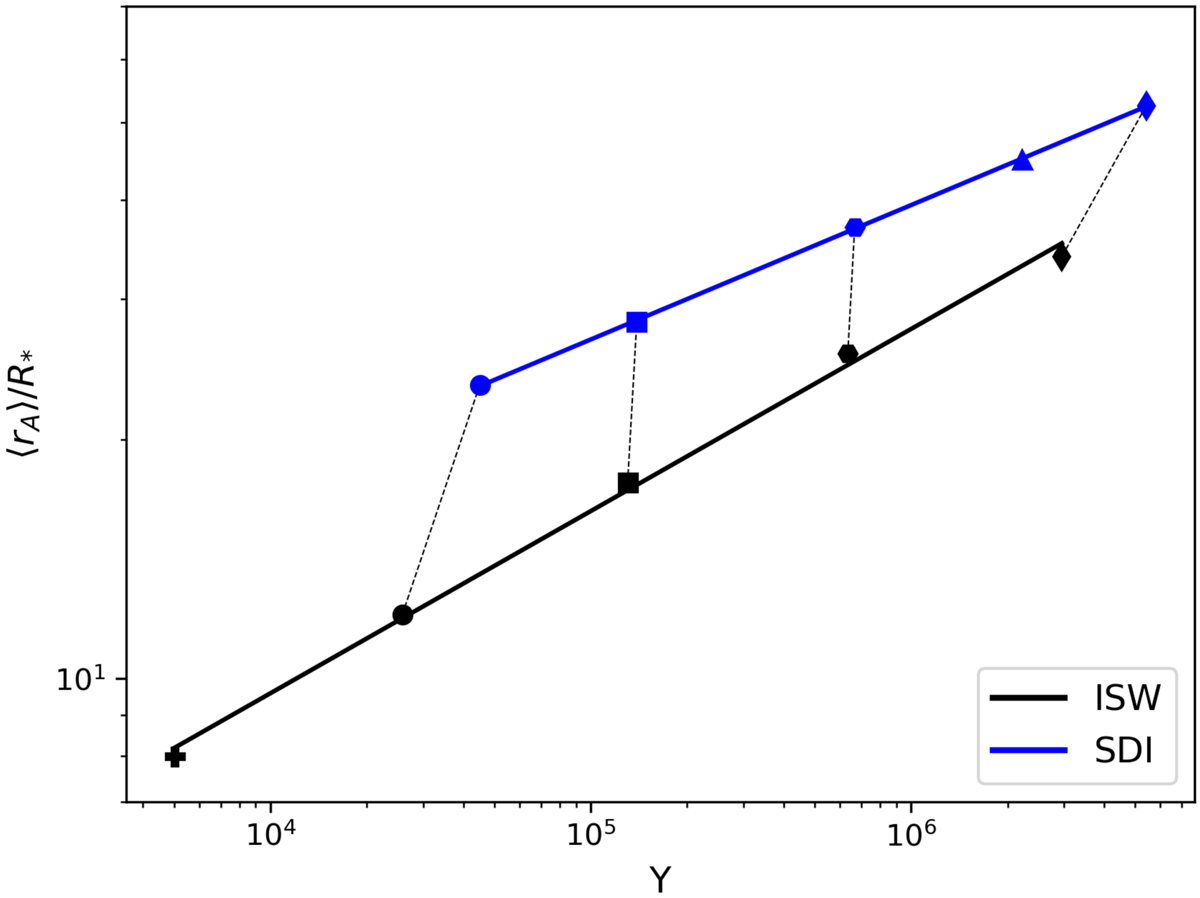
Normalized effective lever arm, ⟨rA⟩/R*, as a function of the wind magnetization, Υ, for all the cases in this work. As in Fig. 3, each data point is a single simulation. The blue and black colored points (or fitting curves) correspond to SDI and ISW simulations, respectively. Data points with the same symbol, connected with dashed black lines, correspond to numerical solutions that have the same surface magnetic field strength, B*.
Current usage metrics show cumulative count of Article Views (full-text article views including HTML views, PDF and ePub downloads, according to the available data) and Abstracts Views on Vision4Press platform.
Data correspond to usage on the plateform after 2015. The current usage metrics is available 48-96 hours after online publication and is updated daily on week days.
Initial download of the metrics may take a while.