Open Access
Fig. 3.
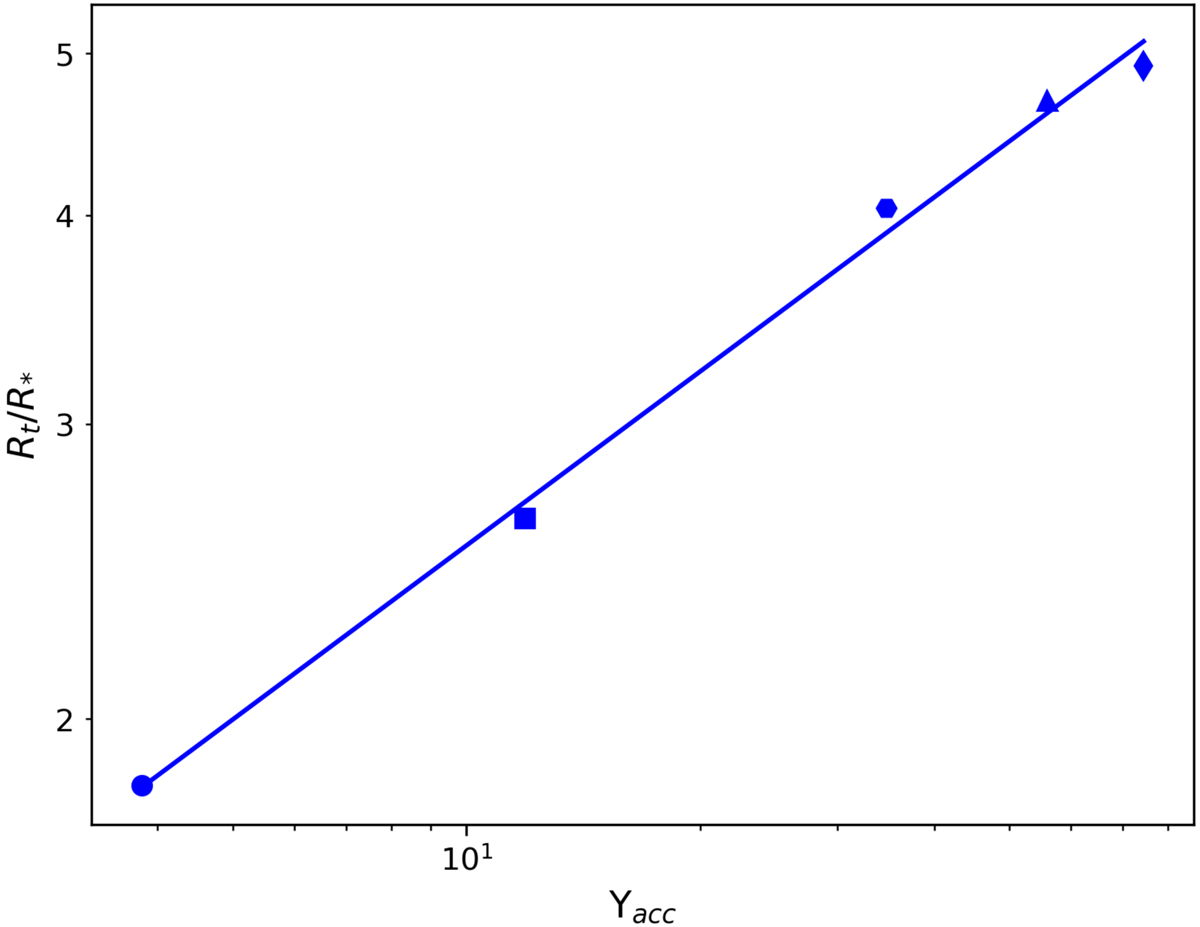
Normalized truncation radius, Rt/R*, as a function of parameter Υacc. Each symbol (or data point) in the plot represents a single SDI simulation. The solid line shows the fitting function (29), with Kt = 1.1452 and mt = 0.35.
Current usage metrics show cumulative count of Article Views (full-text article views including HTML views, PDF and ePub downloads, according to the available data) and Abstracts Views on Vision4Press platform.
Data correspond to usage on the plateform after 2015. The current usage metrics is available 48-96 hours after online publication and is updated daily on week days.
Initial download of the metrics may take a while.