Fig. 1.
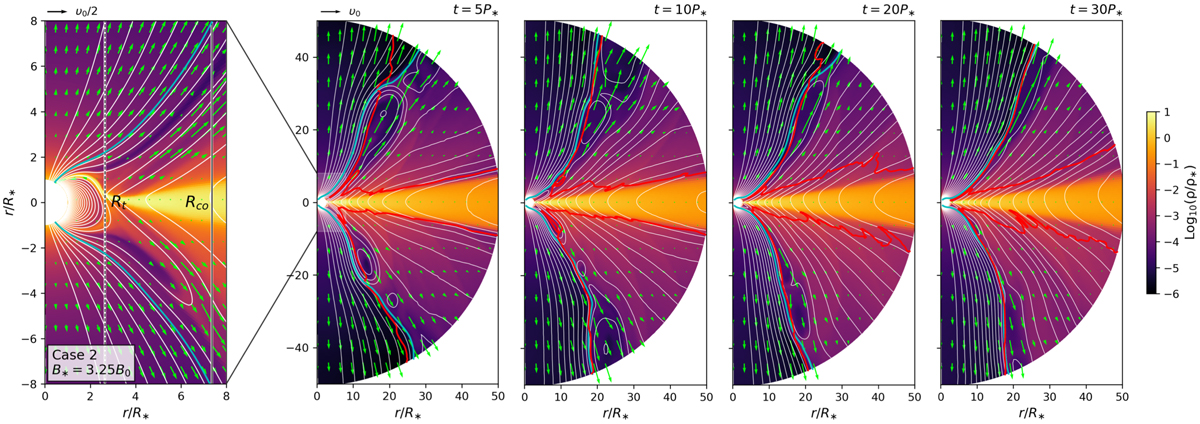
Logarithmic normalized density (colormaps) showing the temporal evolution of an SDI simulation. The snapshots were taken after five, ten, 20, and 30 stellar rotation periods, P*. The far-left panel illustrates the inner domain of this simulation, with the vertical white lines indicating the location of the truncation radius Rt (dashed black core) and corotation radius Rco (solid black core). Each plot includes magnetic field lines (white lines) and velocity-field vectors. The cyan lines delimit the stellar-wind flux tube, and the red lines mark the Alfvén surface.
Current usage metrics show cumulative count of Article Views (full-text article views including HTML views, PDF and ePub downloads, according to the available data) and Abstracts Views on Vision4Press platform.
Data correspond to usage on the plateform after 2015. The current usage metrics is available 48-96 hours after online publication and is updated daily on week days.
Initial download of the metrics may take a while.