Fig. 8.
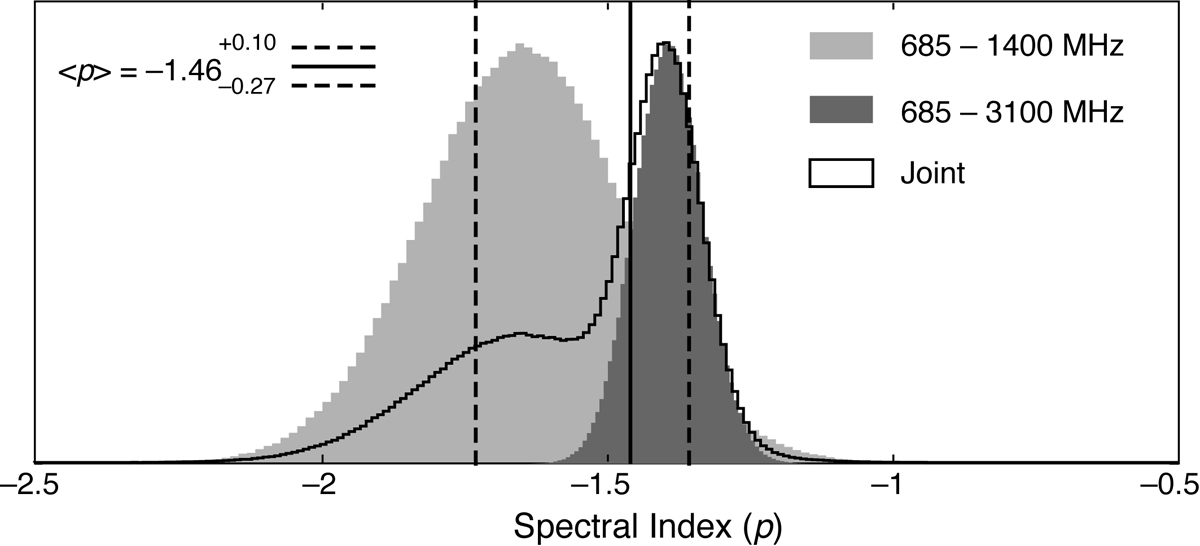
Probability distributions of the spectral index of pulsar B’s radio emission, calculated assuming a single power-law between 685 and 1400 MHz (light grey shade) and 685 and 3100 MHz (dark grey shade), from multi-frequency profiles corresponding to roughly the same orbital phase and separated in time by roughly 30 days. The joint probability distribution is shown with a solid black line, and the corresponding median spectral index and 68% confidence interval, with solid and dashed vertical lines, respectively.
Current usage metrics show cumulative count of Article Views (full-text article views including HTML views, PDF and ePub downloads, according to the available data) and Abstracts Views on Vision4Press platform.
Data correspond to usage on the plateform after 2015. The current usage metrics is available 48-96 hours after online publication and is updated daily on week days.
Initial download of the metrics may take a while.