Fig. 7.
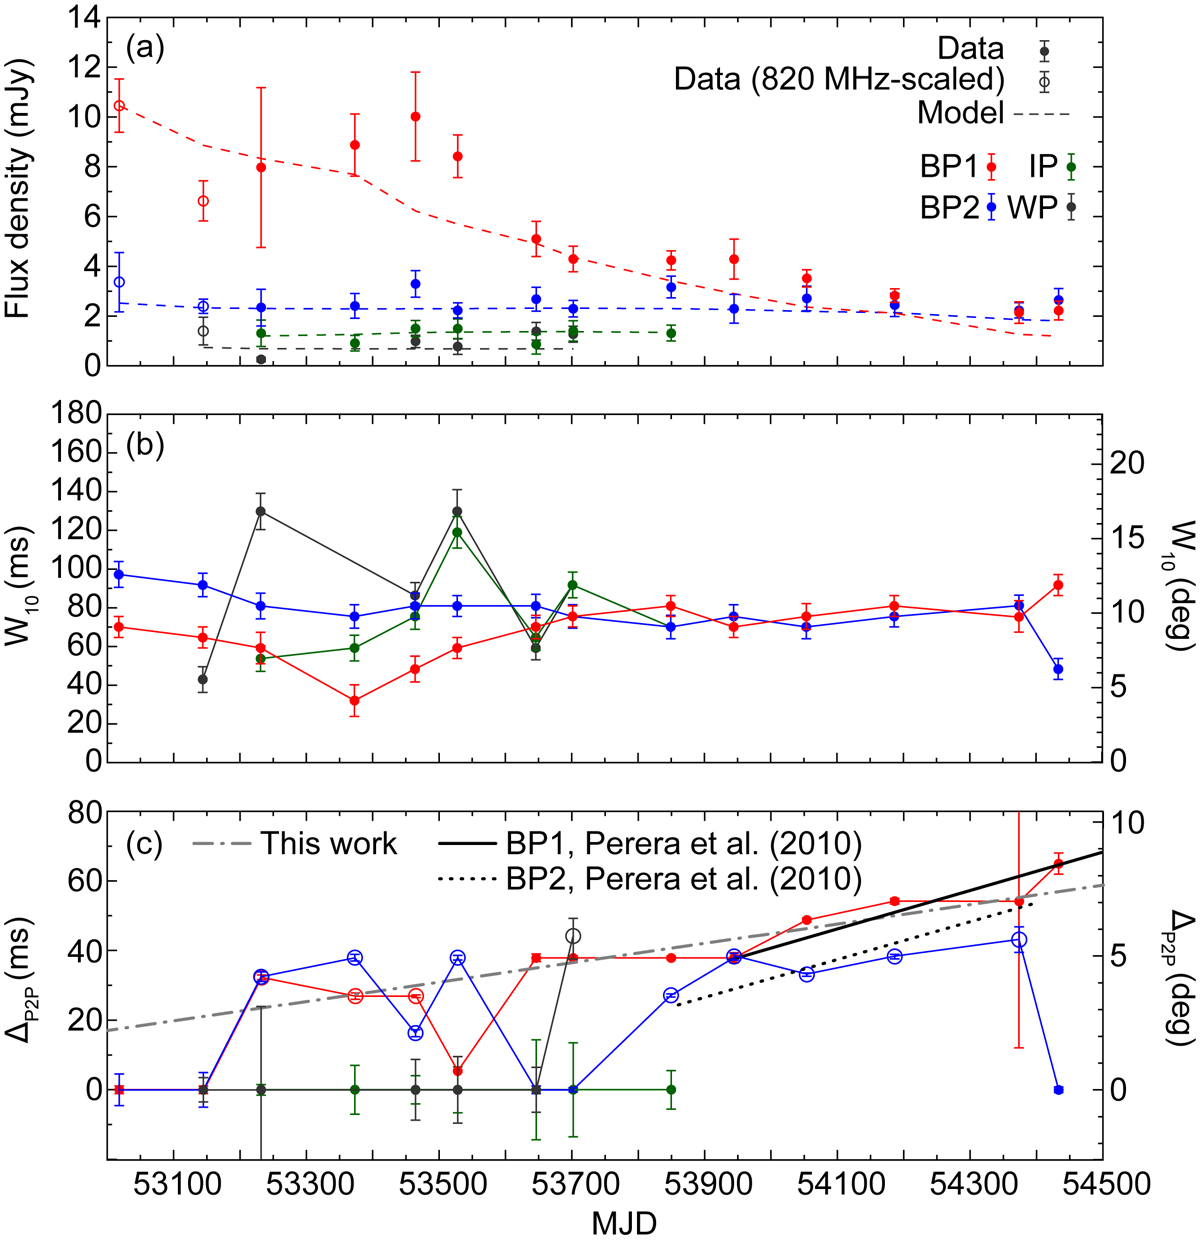
(a) Peak flux density of pulsar B at 820 MHz (filled circles), as a function of MJD, calculated from the average pulse profile corresponding to the centre of BP1 (red), BP2 (blue), IP (green) and to the WP (grey). For the intervals MJD53000–53100 and MJD53100–53200, the flux densities (empty circles) were scaled to 820 MHz from observations at 685 MHz and 1400 MHz, respectively, using the spectral indices reported in Sect. 3.3. In the interval MJD54200–54300, there were no available data. The dashed lines show the best fit light curves of the peak flux density of the model. (b) Full pulse width at 10% of the maximum (W10) as a function of MJD, for the average profiles corresponding roughly to the centre of the orbital-phase range of BP1 (red), BP2 (blue), the IP (green), and the WP (grey). (c) Peak separation (ΔP2P) between the leading and trailing component of the average profiles. Open circles indicate that the brightest component is trailing. The dash-dotted grey line is the best linear fit to the BP1 data from this work (see Sect. 3.2); the solid and dotted black lines are the best linear fits to the BP1 and BP2 data, respectively, across the corresponding ranges shown by Perera et al. (2010). All values shown have been calculated from the best fit Gaussian templates of Fig. B.3.
Current usage metrics show cumulative count of Article Views (full-text article views including HTML views, PDF and ePub downloads, according to the available data) and Abstracts Views on Vision4Press platform.
Data correspond to usage on the plateform after 2015. The current usage metrics is available 48-96 hours after online publication and is updated daily on week days.
Initial download of the metrics may take a while.