Fig. 6.
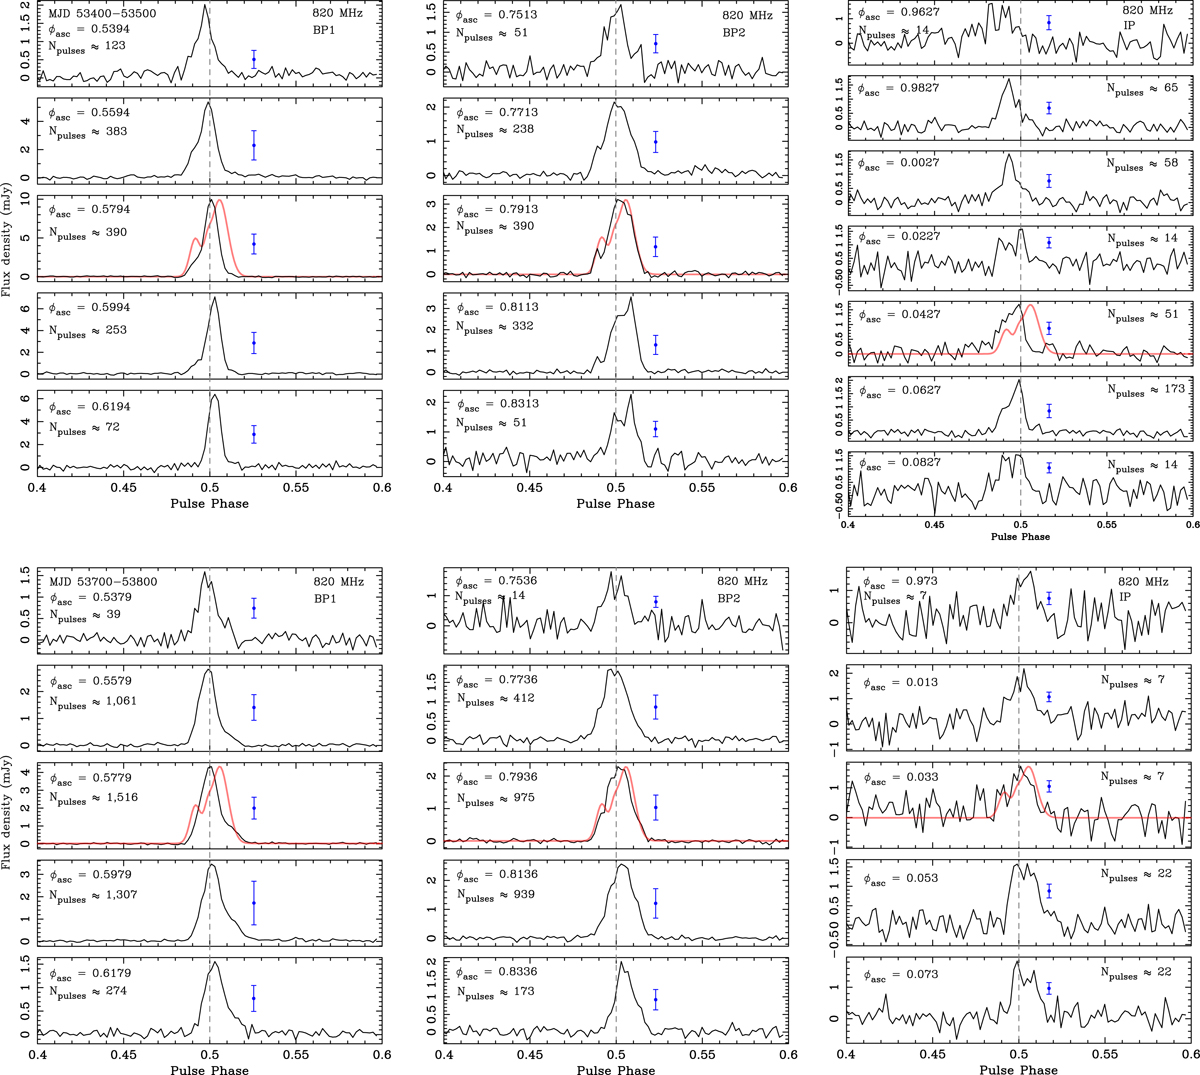
Profile evolution of pulsar B at 820 MHz, during BP1, BP2, and the IP, corresponding to two MJD bins: (top half) MJD53400–53500 and (bottom half) MJD53700−53800. Each profile comes from averaging the original data in the corresponding MJD bin and an orbital-phase interval of Δϕasc/2π = 0.02, centred around the orbital phase, ϕasc, shown in each panel. The number of single pulses averaged to obtain each profile are also shown at the top-left corner of each panel. The grey, vertical dashed lines at pulse phase 0.5 are used here to guide the eye and to highlight the relative changes between profiles observed during most BPs. We note that the profile alignment in this figure can only be used to compare the profiles of a single MJD bin and orbital-phase window (see main text for details). The blue, vertical error bar next to each profile corresponds to the quadrature sum of the off-pulse RMS of the profile shown, σstat, and the average RMS due to systematic pulse-to-pulse variations of the profiles that were summed to obtain the profile shown (see Sect. 3.2.2). For comparison, we have overlaid the analytic WP template profile of Fig. 4 with the observed average profiles corresponding roughly to the middle of BP1, BP2, and the IP.
Current usage metrics show cumulative count of Article Views (full-text article views including HTML views, PDF and ePub downloads, according to the available data) and Abstracts Views on Vision4Press platform.
Data correspond to usage on the plateform after 2015. The current usage metrics is available 48-96 hours after online publication and is updated daily on week days.
Initial download of the metrics may take a while.