Fig. 5.
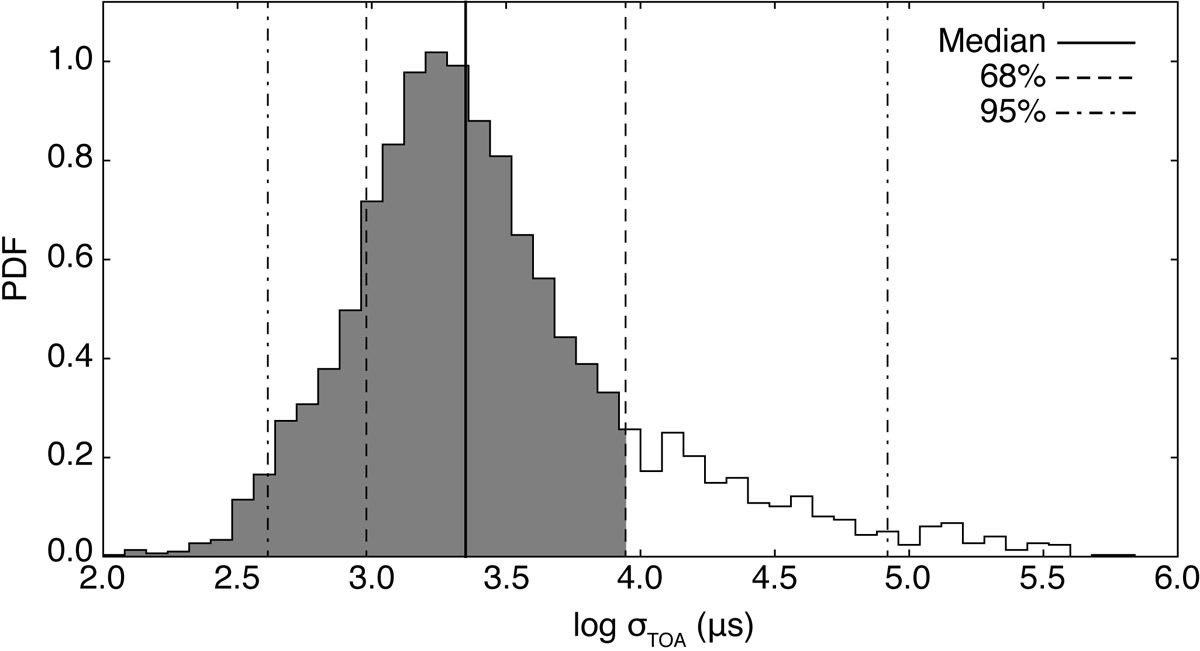
Probability density function (PDF) of the logarithm of TOA uncertainties, σTOA (in μs), from the cross-correlation of all of the original data profiles (after RFI excision) with the WP template profile of Fig. 4. The solid, dashed, and dashed-dotted vertical lines correspond to the median, the 68%, and 95% confidence intervals of the distribution, respectively. The unshaded area of the histogram corresponds to the range of uncertainties (σTOA > 9.3 ms) corresponding to TOAs that were excluded from further analysis.
Current usage metrics show cumulative count of Article Views (full-text article views including HTML views, PDF and ePub downloads, according to the available data) and Abstracts Views on Vision4Press platform.
Data correspond to usage on the plateform after 2015. The current usage metrics is available 48-96 hours after online publication and is updated daily on week days.
Initial download of the metrics may take a while.