Fig. 3.
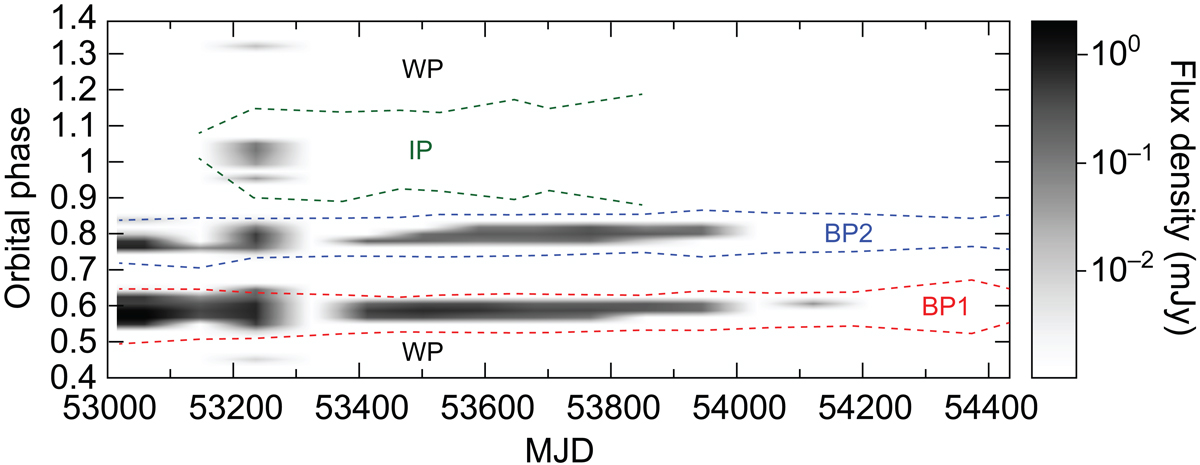
Greyscale map of pulse-averaged flux density of pulsar B, as in Fig. 2, as a function of orbital phase and MJD. Bilinear interpolation between bins has been applied. The red, blue and green dashed lines delineate the orbital-phase regions of BP1, BP2, and IP as a function of MJD, assuming the corresponding 3σ widths shown in Table 2. We note that the IP is undetectable before MJD53100 and after MJD53900. The WP is defined as the orbital-phase region between the upper bound of IP and lower bound of BP1.
Current usage metrics show cumulative count of Article Views (full-text article views including HTML views, PDF and ePub downloads, according to the available data) and Abstracts Views on Vision4Press platform.
Data correspond to usage on the plateform after 2015. The current usage metrics is available 48-96 hours after online publication and is updated daily on week days.
Initial download of the metrics may take a while.