Fig. B.4.
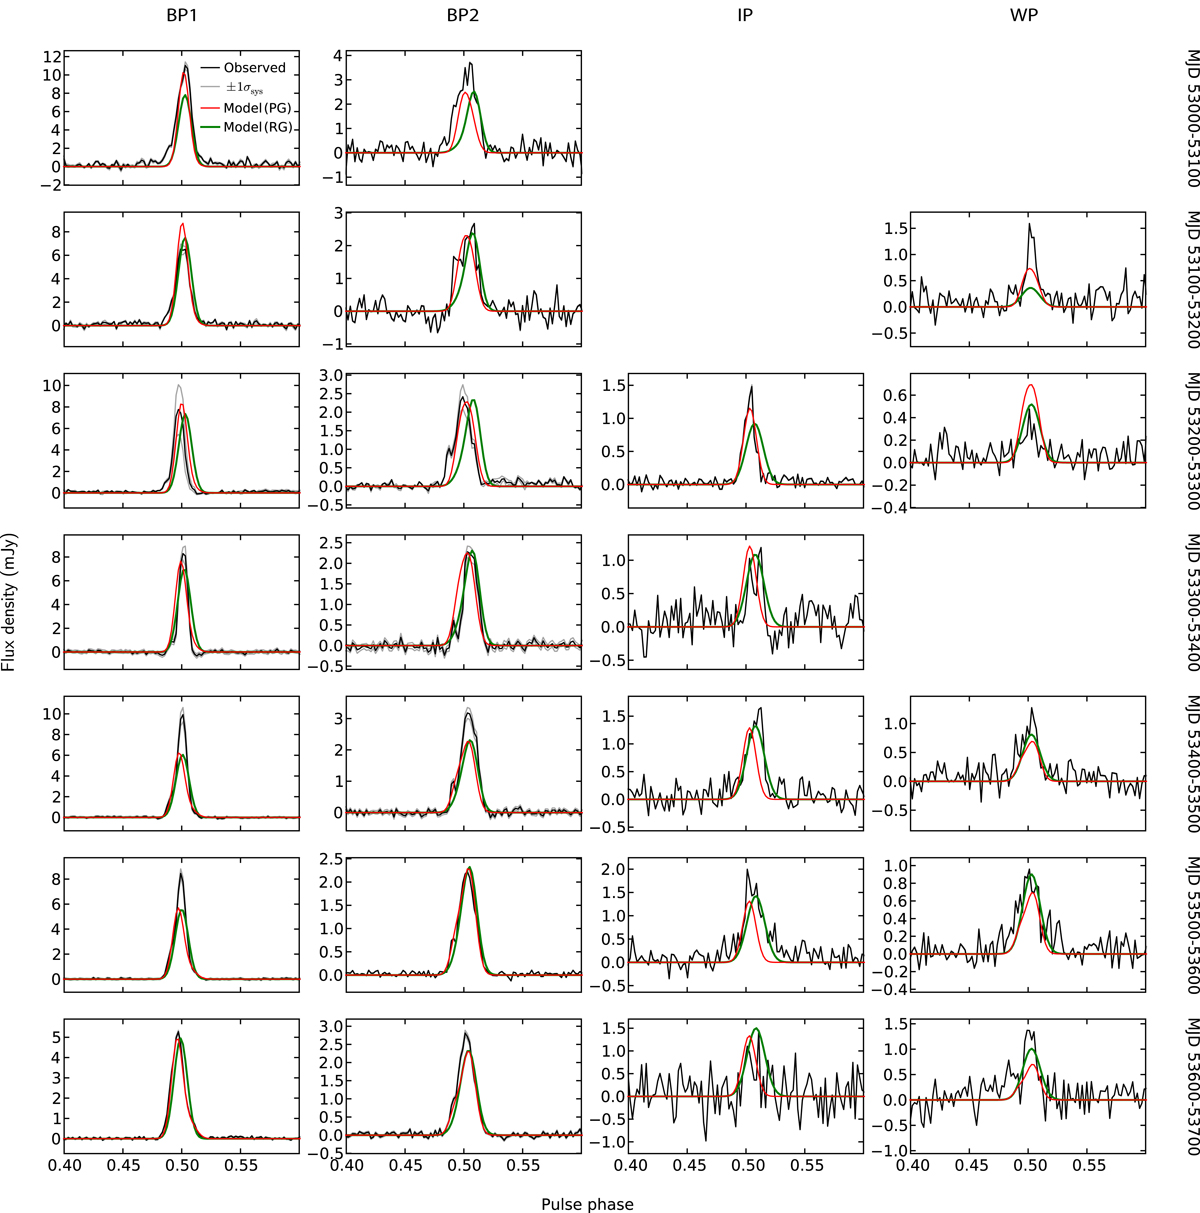
Comparison between observed profiles (black) and those produced by our simulation, as described in Sect. 4, using the model parameters with the highest likelihood and a prograde (PG) pulsar spin (red). Green lines show the most likely profiles of an alternative model with a retrograde (RG) pulsar spin. The profiles shown have been tabulated according to orbital phase window, that is, BP1, BP2, IP, and WP, and the MJD range to which they belong. The grey lines show the lower and upper 1σsys confidence limits of the observed flux density, multiplied by the most likely error coefficients (qkj) that were derived from our analysis.
Current usage metrics show cumulative count of Article Views (full-text article views including HTML views, PDF and ePub downloads, according to the available data) and Abstracts Views on Vision4Press platform.
Data correspond to usage on the plateform after 2015. The current usage metrics is available 48-96 hours after online publication and is updated daily on week days.
Initial download of the metrics may take a while.