Fig. B.3.
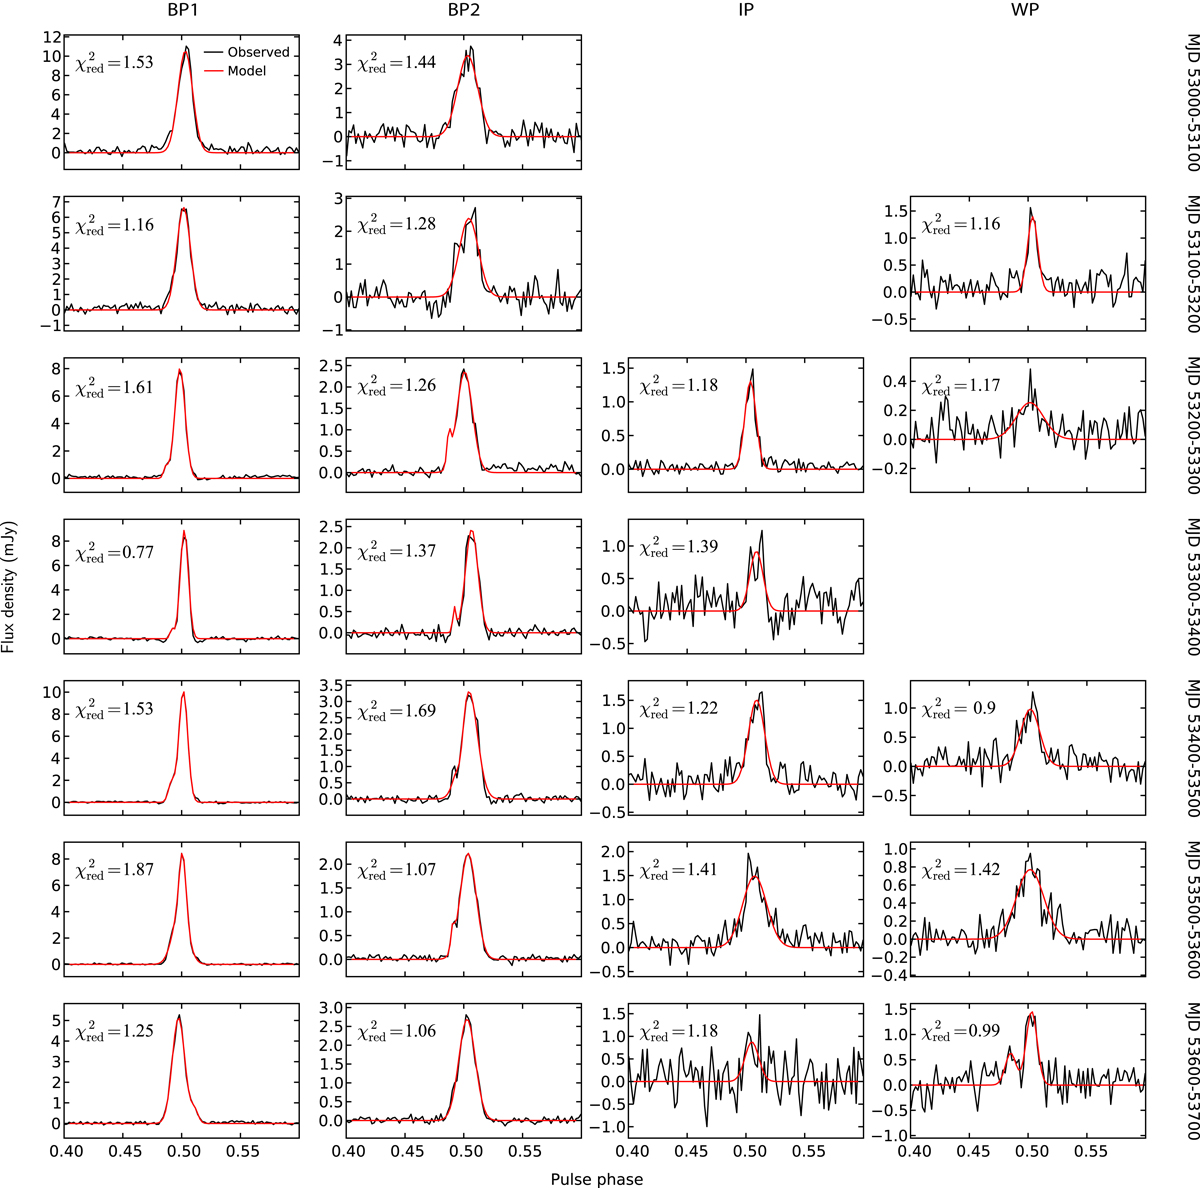
Comparison between observed average profiles of pulsar B (black) and the best fit Gaussian templates (red), as described in Sect. 3.2.3. The profiles shown have been tabulated according to orbital-phase window (columns): BP1, BP2, IP, and WP, and the MJD range (rows). The reduced chi-squared value shown for each plot has been calculated using only the off-pulse RMS (σstat) as weights.
Current usage metrics show cumulative count of Article Views (full-text article views including HTML views, PDF and ePub downloads, according to the available data) and Abstracts Views on Vision4Press platform.
Data correspond to usage on the plateform after 2015. The current usage metrics is available 48-96 hours after online publication and is updated daily on week days.
Initial download of the metrics may take a while.