Fig. B.2.
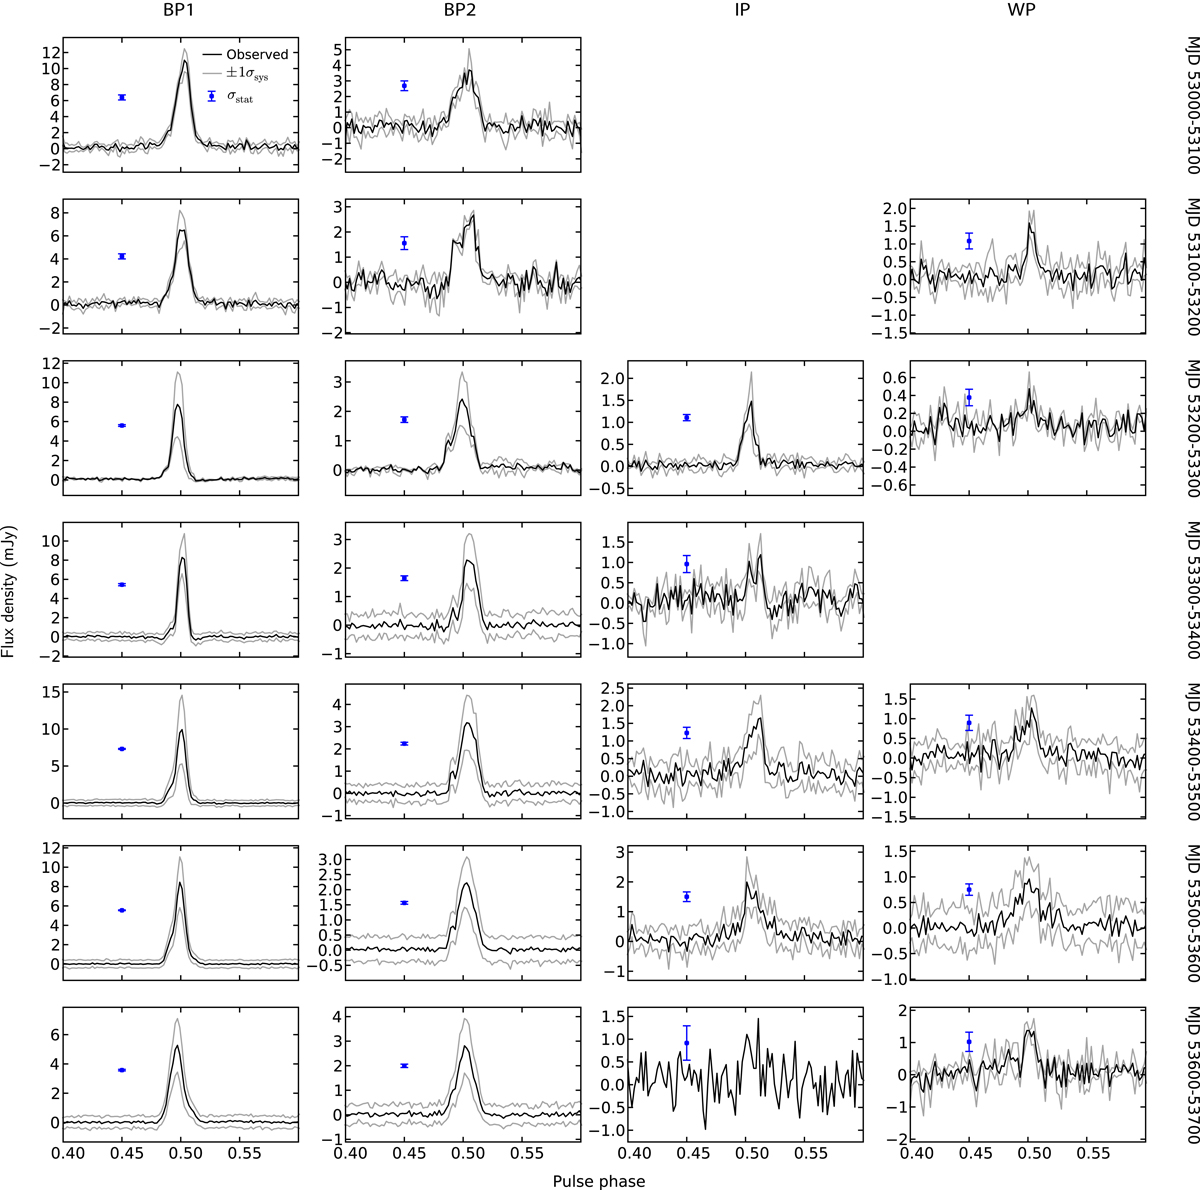
Observed average profiles of pulsar B (black lines), corresponding to the centroids of BP1, BP2, and the IP; the WP profiles were calculated using all the data in that orbital-phase window (see blue error bars in Fig. A.1). Each column corresponds to a different orbital-phase window (labelled along the top edge of the figure); each row corresponds to a different MJD bin (labelled along the right edge of the figure). The grey lines show the lower and upper 1σsys confidence limits (Eq. (7)). The blue vertical error bar next to each profile corresponds to the off-pulse RMS, σstat, of the average profile.
Current usage metrics show cumulative count of Article Views (full-text article views including HTML views, PDF and ePub downloads, according to the available data) and Abstracts Views on Vision4Press platform.
Data correspond to usage on the plateform after 2015. The current usage metrics is available 48-96 hours after online publication and is updated daily on week days.
Initial download of the metrics may take a while.