Fig. B.1.
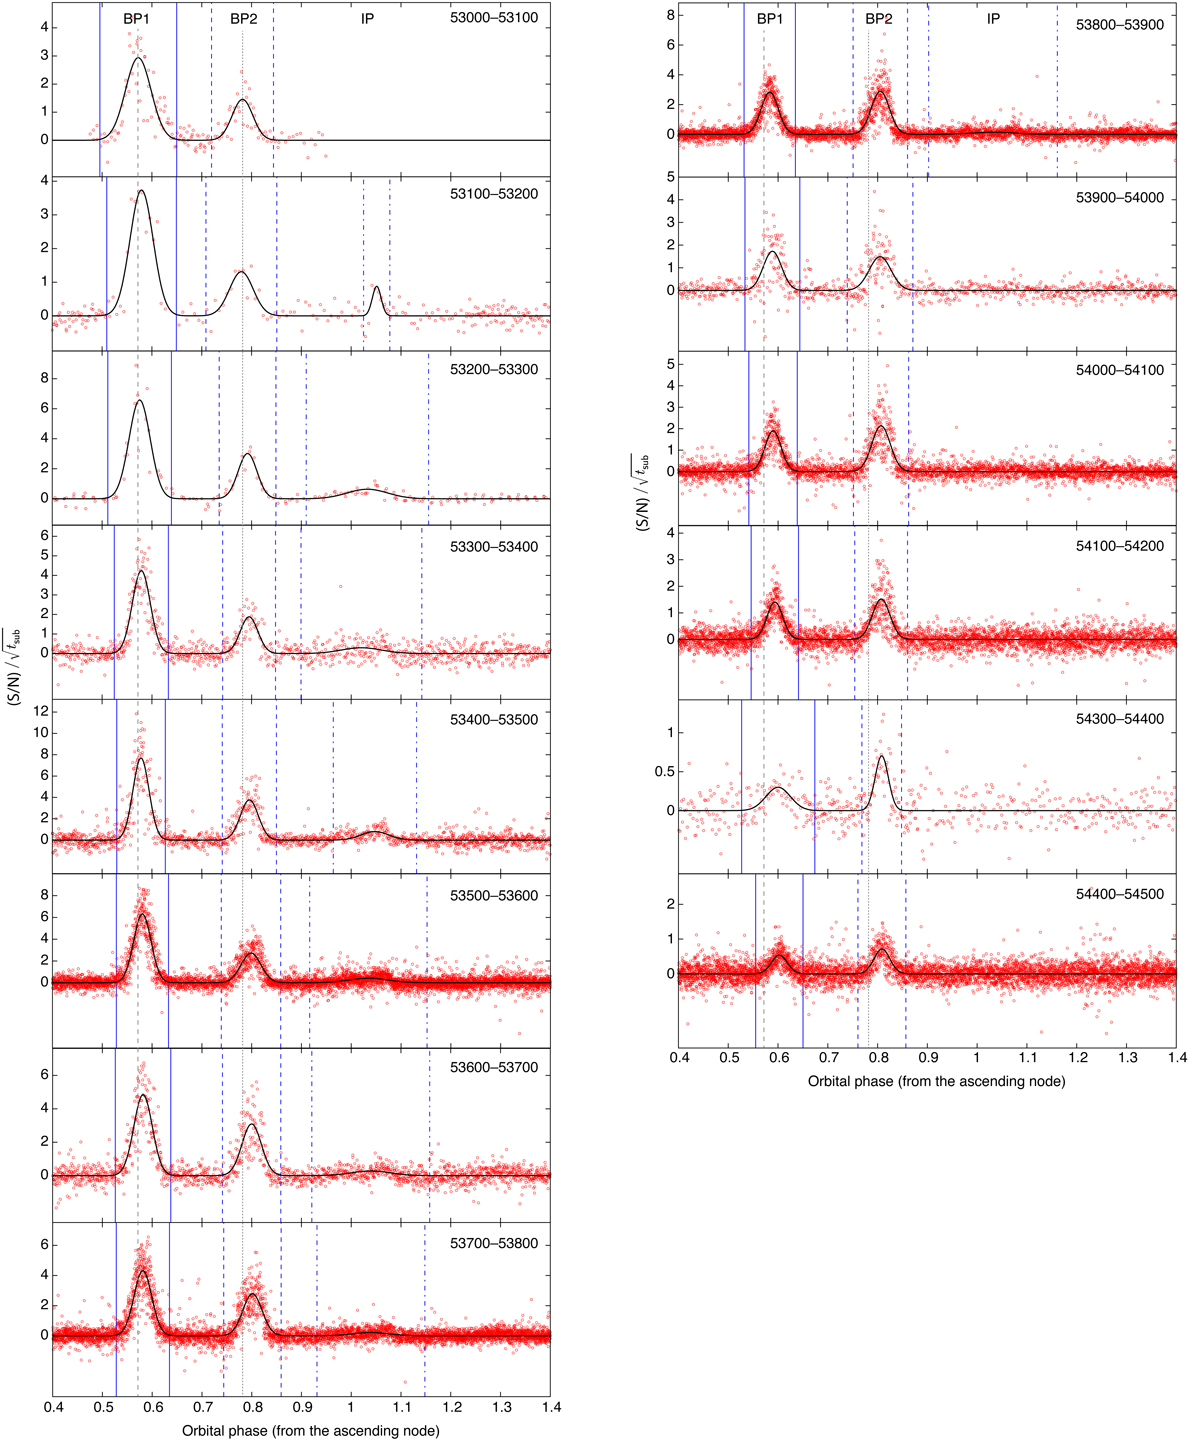
Distributions of S/N across the orbit of pulsar B, for each MJD bin (data points). For this figure, the values of the S/N have been normalised by the square root of the integration time. The locations of the two BPs, BP1 and BP2, and where visible that of the IP have been determined using Gaussian fits to the data (black curves). The vertical, solid, dashed and dot–dashed blue lines show the 3σ confidence intervals of the phase locations of BP1, BP2 and the IP, respectively. To emphasise the shift of the locations of BP1 and BP2, as a function of MJD, the dashed and dotted, vertical, grey lines mark the positions of the maxima of the fitted functions for BP1 and BP2, respectively, during MJD53000–53100.
Current usage metrics show cumulative count of Article Views (full-text article views including HTML views, PDF and ePub downloads, according to the available data) and Abstracts Views on Vision4Press platform.
Data correspond to usage on the plateform after 2015. The current usage metrics is available 48-96 hours after online publication and is updated daily on week days.
Initial download of the metrics may take a while.