Fig. A.4.
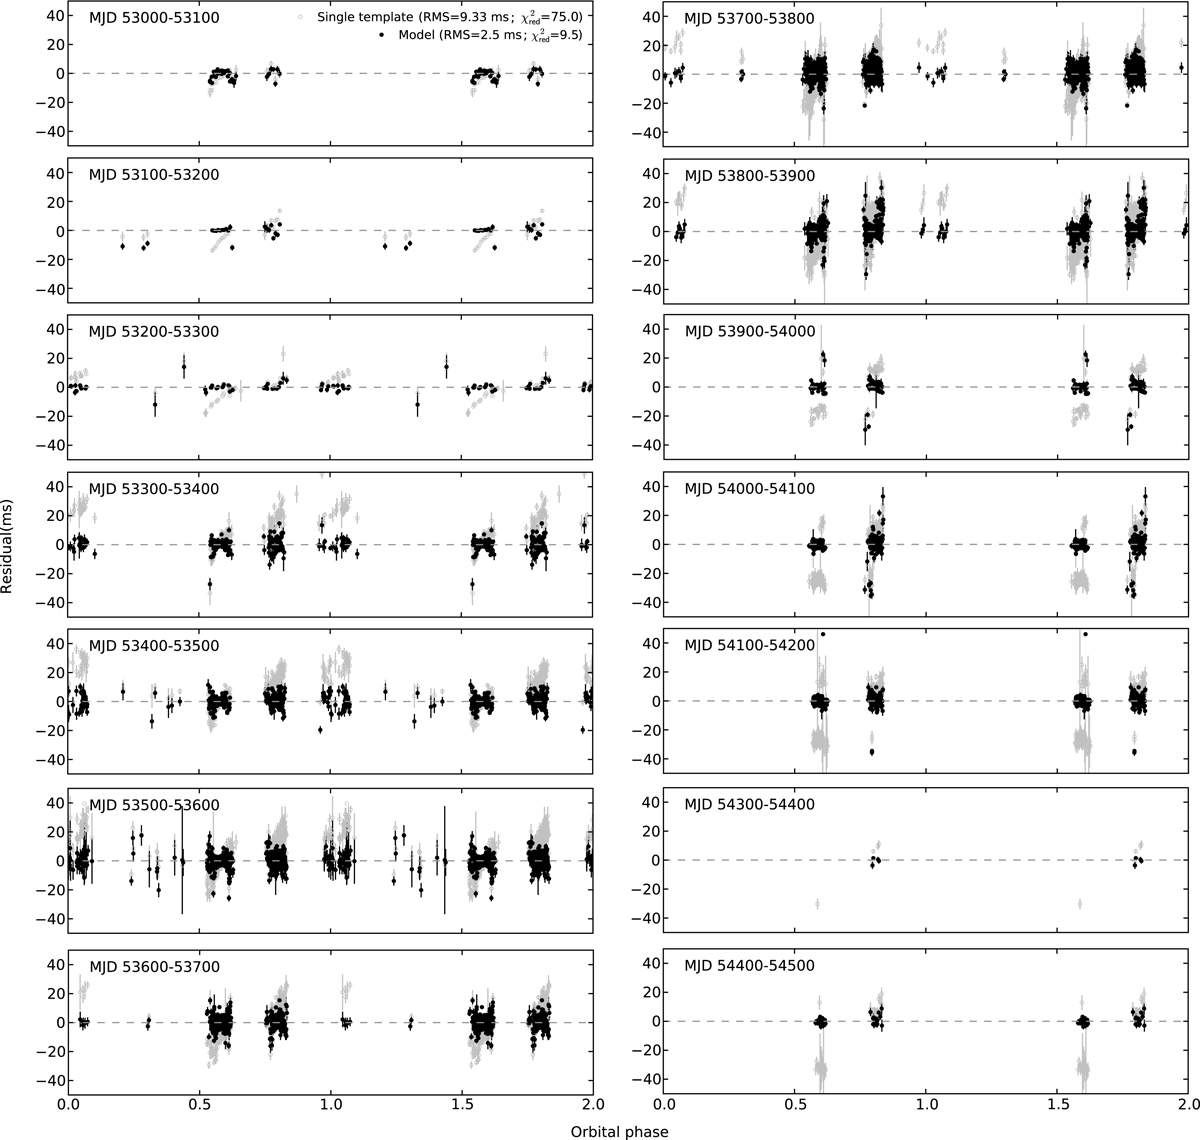
(black points) Timing residuals using Gaussian templates of Fig. B.3 and after correcting for the linear drifts across each orbital-phase window, via the best fits shown in Fig. A.2. For comparison, light grey circles show the timing residuals using the fixed WP template profile of Fig. 4. For each data set, the weighted RMS and the corresponding ![]() , calculated over the entire data set shown in this figure, is shown in the top-right corner of the top-left sub-plot.
, calculated over the entire data set shown in this figure, is shown in the top-right corner of the top-left sub-plot.
Current usage metrics show cumulative count of Article Views (full-text article views including HTML views, PDF and ePub downloads, according to the available data) and Abstracts Views on Vision4Press platform.
Data correspond to usage on the plateform after 2015. The current usage metrics is available 48-96 hours after online publication and is updated daily on week days.
Initial download of the metrics may take a while.