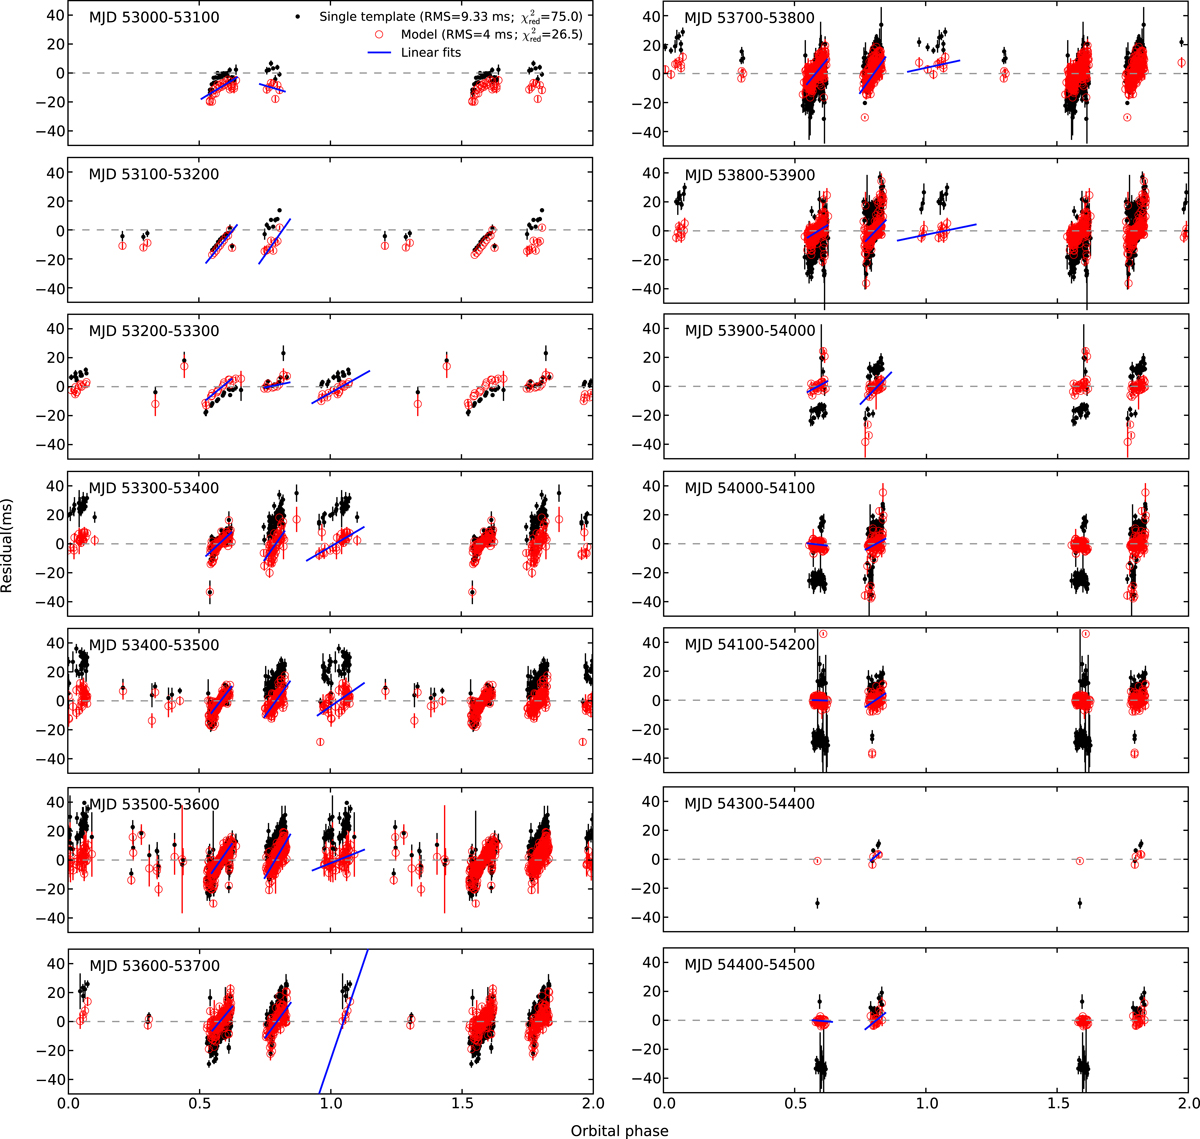
Fig. A.2.

Timing residuals using fixed WP template profile of Fig. 4 (black points) and using the Gaussian templates of Fig. B.3 (red open circles). For each data set, the weighted RMS and the corresponding ![]() , calculated over the entire data set shown in this figure, is shown in the top-right corner of the top-left sub-plot. The blue lines show the best linear fits to the residuals of BP1, BP2, and IP, which were used to correct for the linear drifts across those orbital-phase windows (see Fig. A.4). The orbital-phase extent of the lines is equal to the W3σ value of the corresponding orbital-phase window.
, calculated over the entire data set shown in this figure, is shown in the top-right corner of the top-left sub-plot. The blue lines show the best linear fits to the residuals of BP1, BP2, and IP, which were used to correct for the linear drifts across those orbital-phase windows (see Fig. A.4). The orbital-phase extent of the lines is equal to the W3σ value of the corresponding orbital-phase window.
Current usage metrics show cumulative count of Article Views (full-text article views including HTML views, PDF and ePub downloads, according to the available data) and Abstracts Views on Vision4Press platform.
Data correspond to usage on the plateform after 2015. The current usage metrics is available 48-96 hours after online publication and is updated daily on week days.
Initial download of the metrics may take a while.


