Fig. A.1.
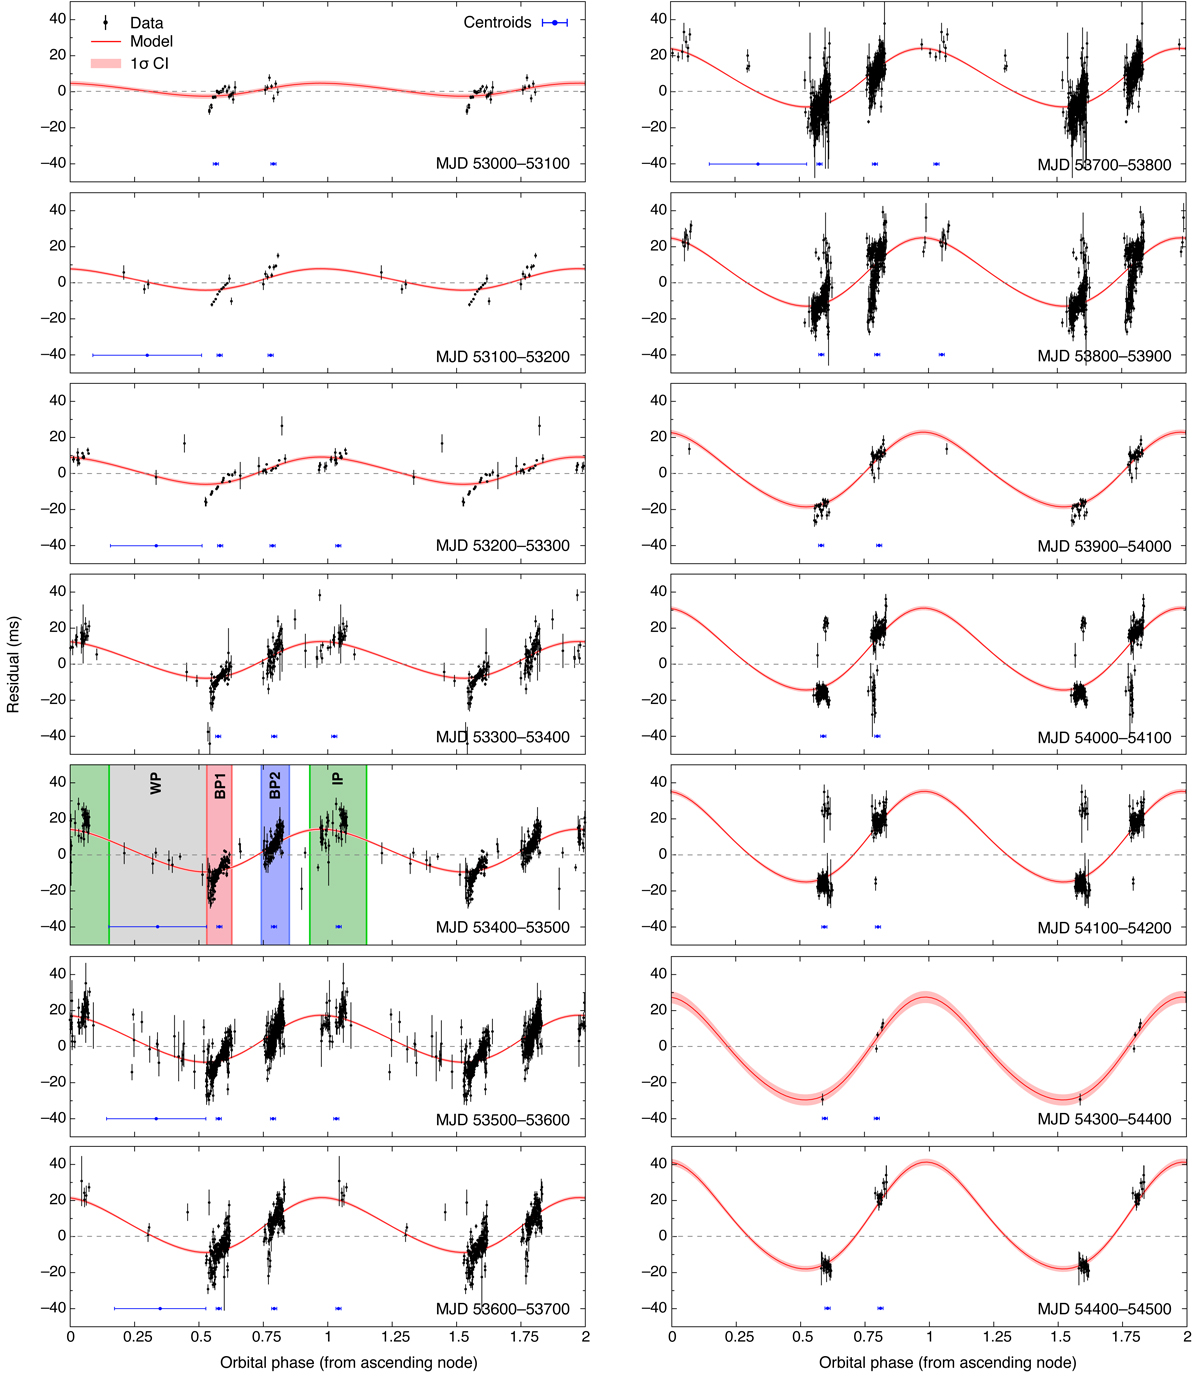
Residuals of pulsar B for 14 100-day intervals, calculated using the analytic WP template of Fig. 4, constructed from fitting a three-Gaussian-component model to the average WP profile of pulsar B. The weighted RMS of the residuals, calculated over the entire data set shown in this figure, is 9.33 ms; the corresponding ![]() value is 75. The red lines correspond to the function of Eq. (9), using the best fit values for the parameter w0. The shaded envelope corresponds to the 1σ confidence interval of the above function. The horizontal blue error bars indicate the orbital-phase intervals, at the location of peak brightness of BP1, BP2, and IP (centroids), that were used to calculate the average profiles of Fig. B.2; for the WP, the entire width of the orbital-phase window was used. Also, the panel corresponding to the interval MJD53400–54500 shows the extents of the orbital-phase regions, BP1, BP2, the IP, and the WP, for that interval, as red, blue, green, and grey shaded areas.
value is 75. The red lines correspond to the function of Eq. (9), using the best fit values for the parameter w0. The shaded envelope corresponds to the 1σ confidence interval of the above function. The horizontal blue error bars indicate the orbital-phase intervals, at the location of peak brightness of BP1, BP2, and IP (centroids), that were used to calculate the average profiles of Fig. B.2; for the WP, the entire width of the orbital-phase window was used. Also, the panel corresponding to the interval MJD53400–54500 shows the extents of the orbital-phase regions, BP1, BP2, the IP, and the WP, for that interval, as red, blue, green, and grey shaded areas.
Current usage metrics show cumulative count of Article Views (full-text article views including HTML views, PDF and ePub downloads, according to the available data) and Abstracts Views on Vision4Press platform.
Data correspond to usage on the plateform after 2015. The current usage metrics is available 48-96 hours after online publication and is updated daily on week days.
Initial download of the metrics may take a while.