Fig. 18.
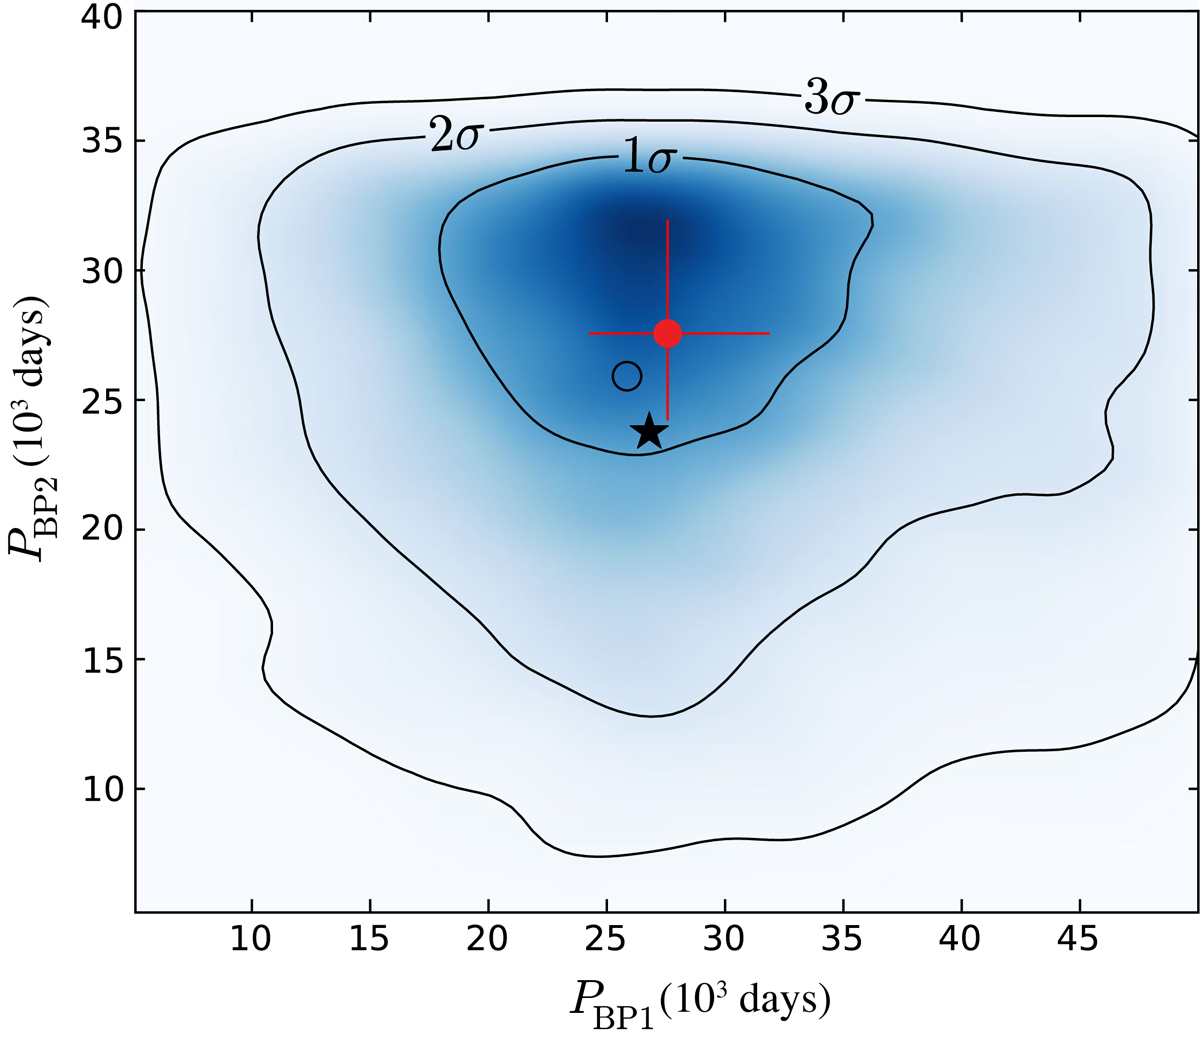
Joint 2D probability-density map of the period (in 103 days) of the sinusoidal functions that were fit to the locations of BP1 and BP2 as a function of time (see Fig. 17). The median and 1σ uncertainties of the period of geodetic precession period of pulsar B, published by Breton et al. (2008), is shown with a filled red circle with error bars. The star symbol corresponds to the most likely values of the periods from our analysis. Finally, the empty circle corresponds to the period of geodetic precession predicted by GR.
Current usage metrics show cumulative count of Article Views (full-text article views including HTML views, PDF and ePub downloads, according to the available data) and Abstracts Views on Vision4Press platform.
Data correspond to usage on the plateform after 2015. The current usage metrics is available 48-96 hours after online publication and is updated daily on week days.
Initial download of the metrics may take a while.