Fig. 17.
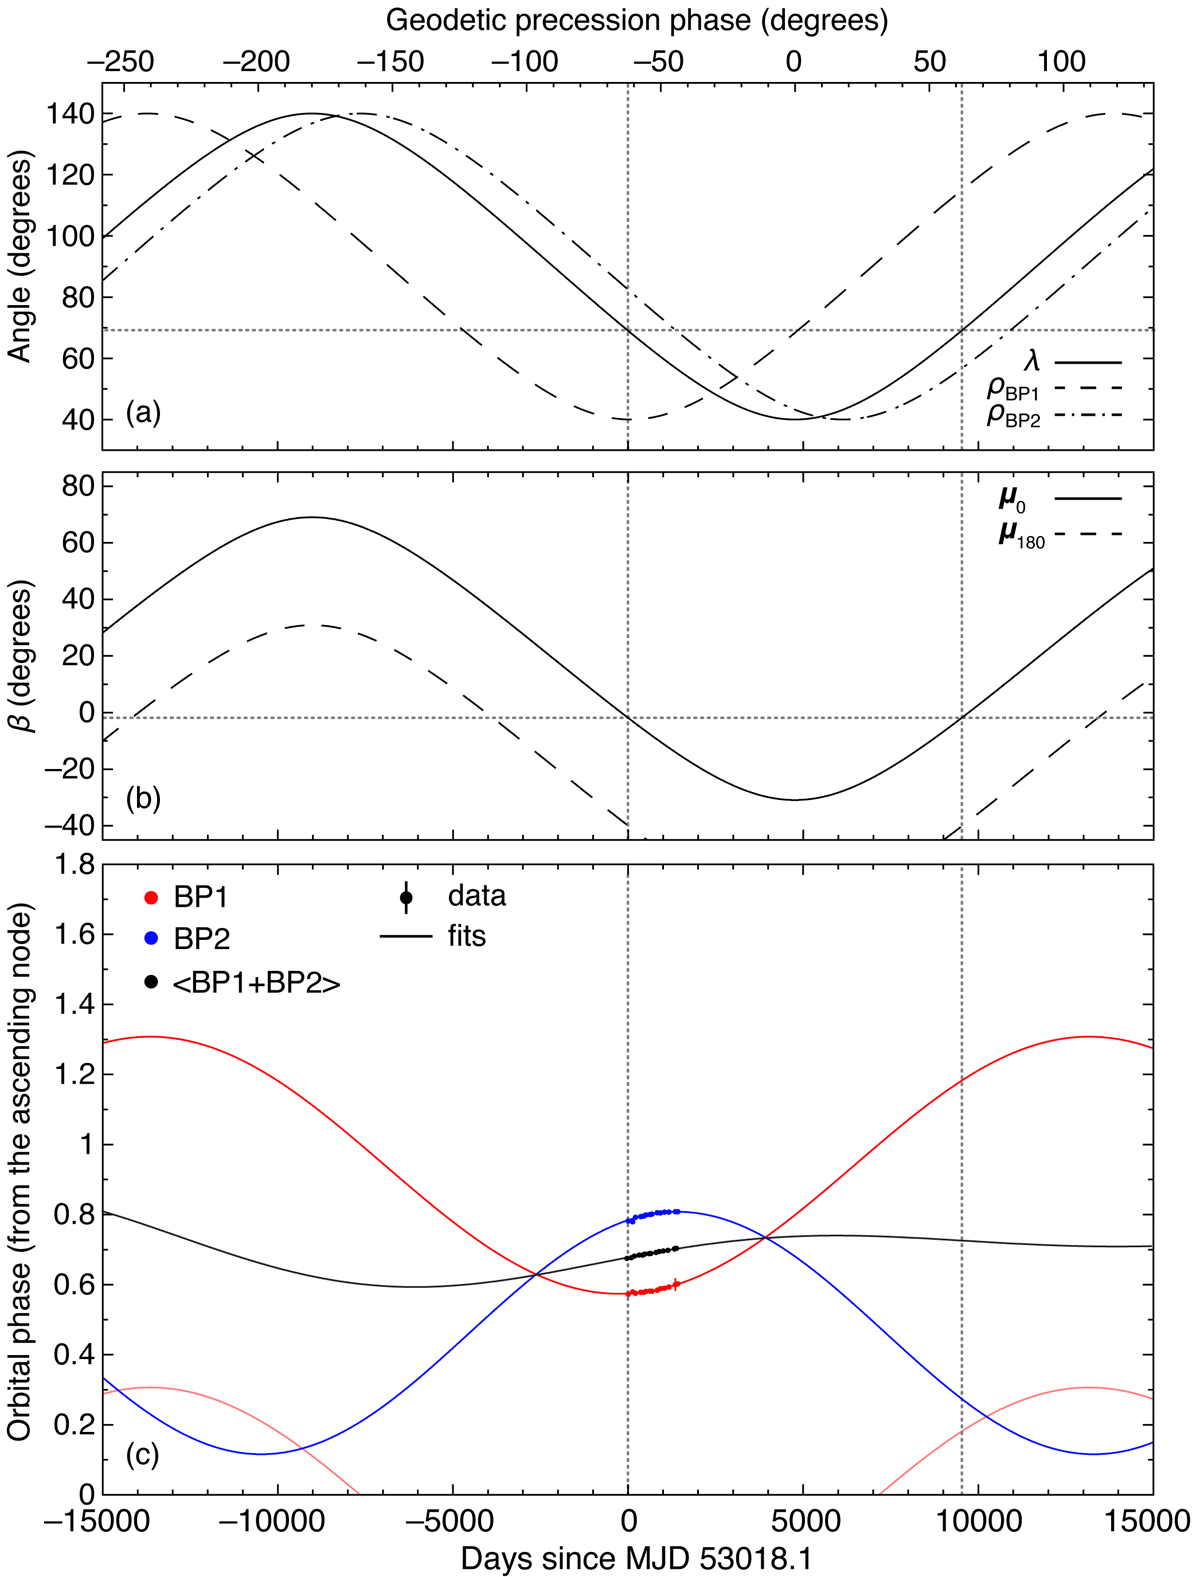
(a) Time evolution of λ, which is the angle between the spin axis of pulsar B and the LOS, and ρ, which is the angle between the spin axis of pulsar B and the radial wind direction, calculated at the centroids of BP1 and BP2, ca. MJD53600. Time, along the bottom horizontal axis, is expressed as days since the epoch of the earliest MJD bin (MJD53018.1). Along the top horizontal axis, we show the corresponding phase of geodetic precession during the interval considered. (b) Time evolution of the impact angle, β, for the magnetic pole that was visible until ca. 2008 (solid curve), and the opposite magnetic pole (dashed curve). (c) Best fit sinusoidal functions of the location of BP1 (red curve and data points) and BP2 (blue curve and data points) as a function of time. The light red curve is the alias of the best fit function for BP1, modulo the orbital period. The solid black curve and data points show the average of the functions and data, respectively. Finally, the vertical dotted grey lines indicate the earliest observation epoch and the subsequent epoch at which the impact angle has the same value as that at the earliest epoch; in (a) and (b), the horizontal dotted grey lines indicate the values of λ and β at those two epochs.
Current usage metrics show cumulative count of Article Views (full-text article views including HTML views, PDF and ePub downloads, according to the available data) and Abstracts Views on Vision4Press platform.
Data correspond to usage on the plateform after 2015. The current usage metrics is available 48-96 hours after online publication and is updated daily on week days.
Initial download of the metrics may take a while.