Open Access
Fig. 16.
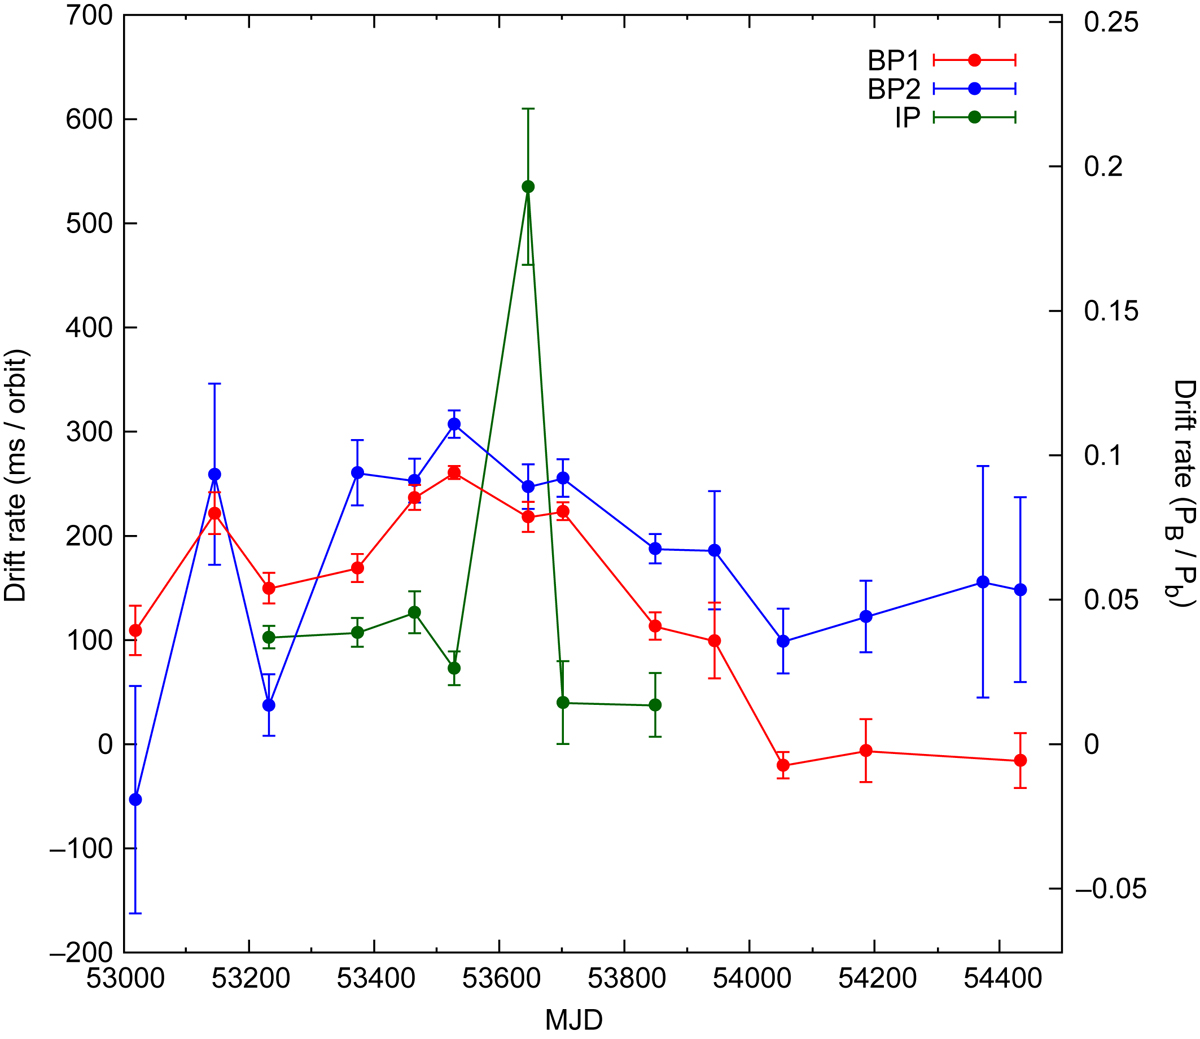
Average drift rate of timing residuals across BP1 (red), BP2 (blue), and the IP (green), as a function of MJD. The drift rates have been estimated from the linear fits shown in Fig. A.2 and are shown both in units of ms per orbit and as a fraction of pulsar B’s spin phase per orbit.
Current usage metrics show cumulative count of Article Views (full-text article views including HTML views, PDF and ePub downloads, according to the available data) and Abstracts Views on Vision4Press platform.
Data correspond to usage on the plateform after 2015. The current usage metrics is available 48-96 hours after online publication and is updated daily on week days.
Initial download of the metrics may take a while.