Fig. 15.
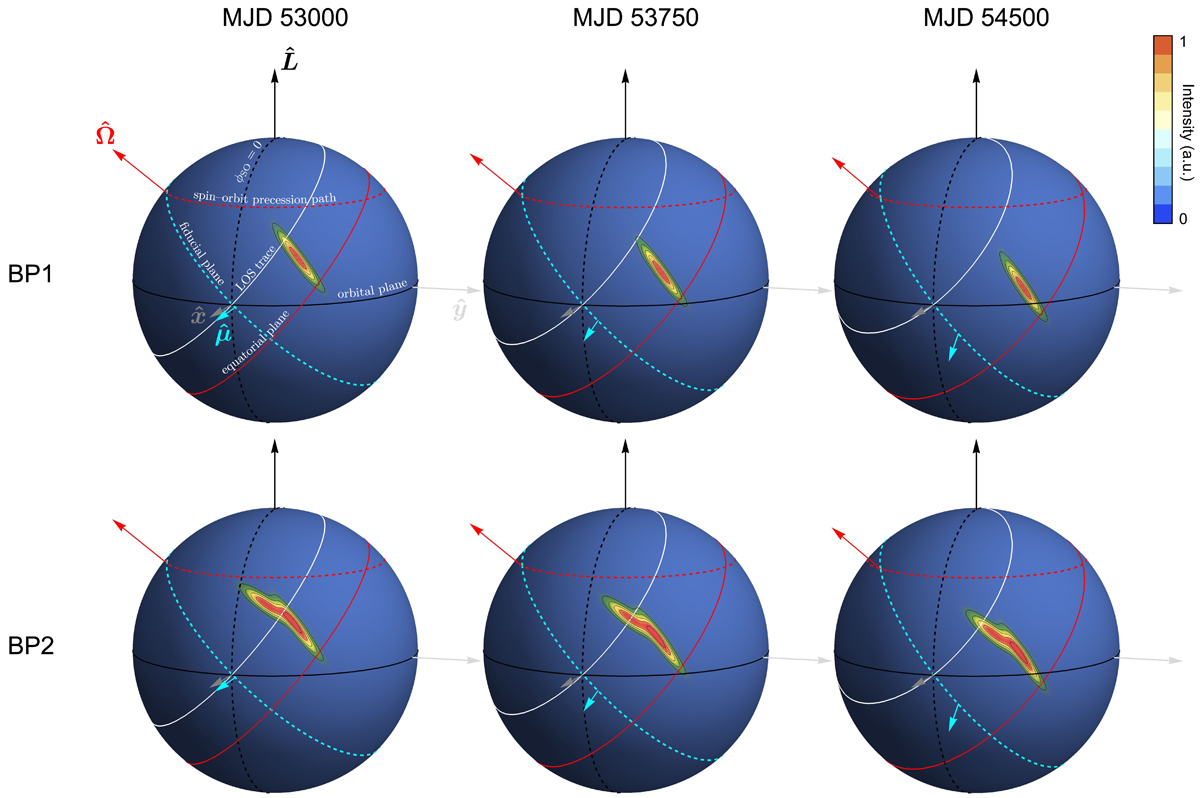
(a) 3D representation of most likely emission beams during BP1, BP2, the IP, and the WP, derived from this work, shown at the minimum approach of the magnetic axis (![]() ) to the LOS (
) to the LOS (![]() ). The figure shows three viewing configurations, corresponding to three geodetic-precession phases, at MJD53000, MJD53750, and MJD54500. The trace of the LOS is shown with a white line. The colour scale represents the beam intensity in arbitrary units, normalised between 0 (blue) and 1(red), in steps of 0.1.
). The figure shows three viewing configurations, corresponding to three geodetic-precession phases, at MJD53000, MJD53750, and MJD54500. The trace of the LOS is shown with a white line. The colour scale represents the beam intensity in arbitrary units, normalised between 0 (blue) and 1(red), in steps of 0.1.
Current usage metrics show cumulative count of Article Views (full-text article views including HTML views, PDF and ePub downloads, according to the available data) and Abstracts Views on Vision4Press platform.
Data correspond to usage on the plateform after 2015. The current usage metrics is available 48-96 hours after online publication and is updated daily on week days.
Initial download of the metrics may take a while.