Fig. 14.
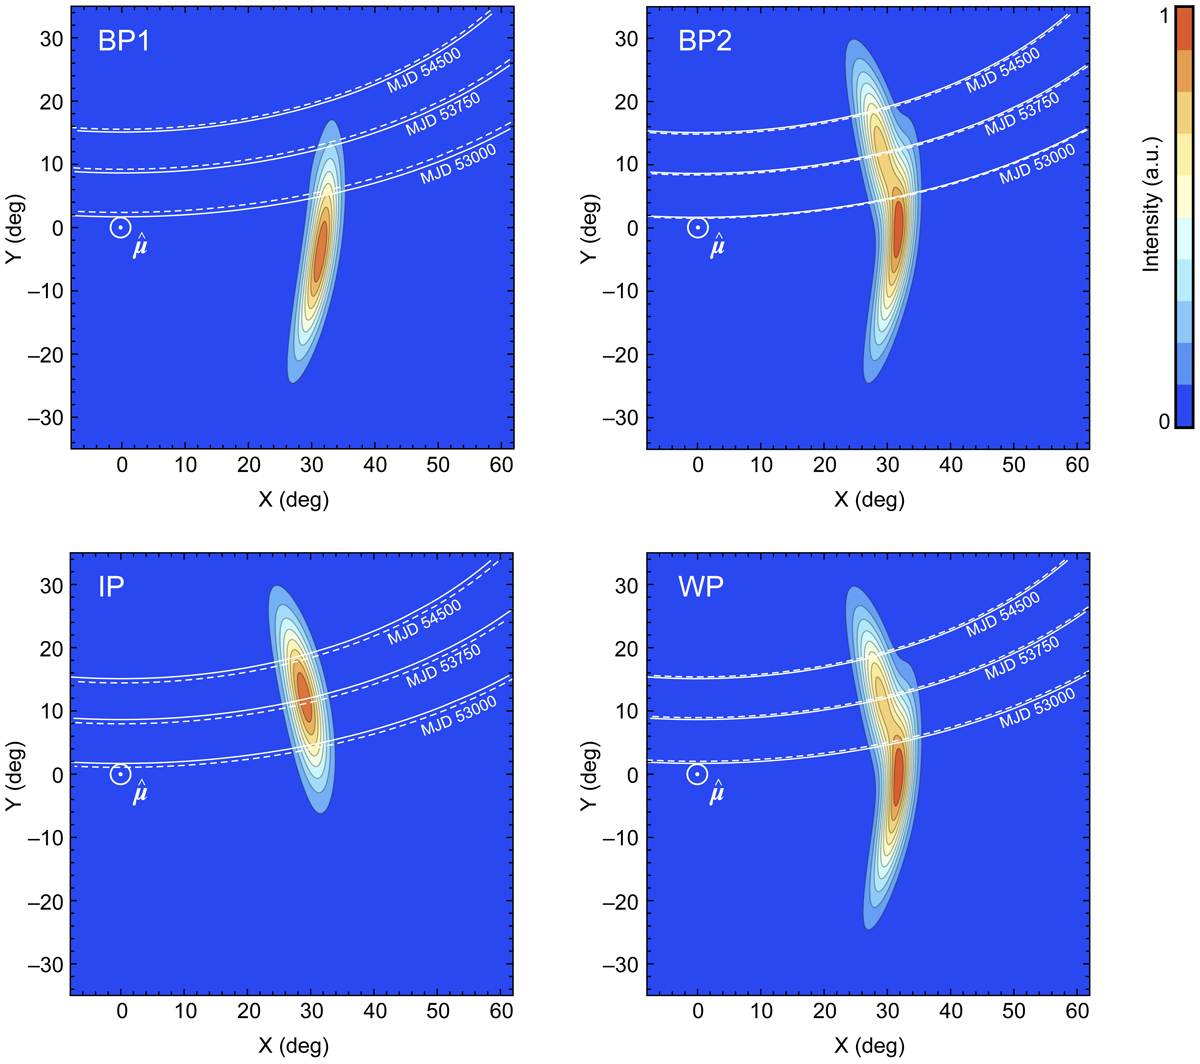
Two-dimensional projection on plane of the sky of most likely emission beams of pulsar B, corresponding to BP1, BP2, the IP, and the WP, as they were determined from our analysis. The Cartesian coordinates shown (X, Y) are defined in Sect. 4.2. In each panel, the intensity has been colour-coded and normalised to a maximum value of 1 (see colour bar) to provide a clear representation of the beam shape; the relative intensity between the orbital phases is not shown. The solid white lines indicate the traces of the unperturbed LOS for MJD53000, MJD53750, and MJD54500; the dashed white lines show the same traces after applying the deflection caused by the most likely magnitude of the wind (i.e. w0 = 0.017). The circled-dot symbol indicates the position of the magnetic axis relative to the beam. A 3D rendering of these beams is provided in Fig. 15.
Current usage metrics show cumulative count of Article Views (full-text article views including HTML views, PDF and ePub downloads, according to the available data) and Abstracts Views on Vision4Press platform.
Data correspond to usage on the plateform after 2015. The current usage metrics is available 48-96 hours after online publication and is updated daily on week days.
Initial download of the metrics may take a while.