Fig. 13.
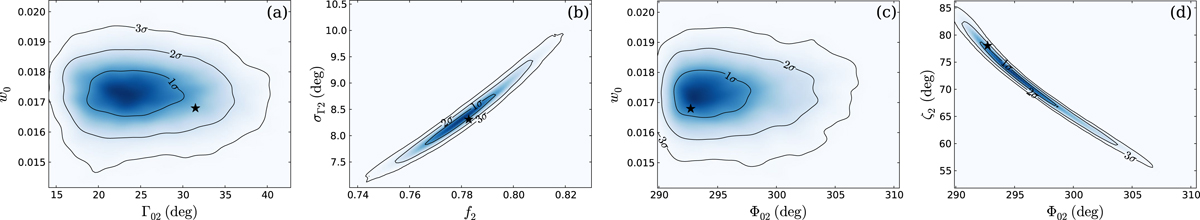
Probability density plots of four pairs of model parameters, corresponding to the second Gaussian beam component, from our analysis: (a) Γ02–w0, the beam colatitude of the peak intensity of the Gaussian component against the wind magnitude; (b) f2–σΓ2, the flatness parameter against the half-beam width along the direction of increasing Γ02; (c) Φ02–w0, the beam longitude of the peak intensity of the Gaussian component against the wind magnitude; and (d) Φ02–ζ2, the beam longitude of the peak intensity of the Gaussian component against the angle of rotation about the direction of peak intensity. The star symbols indicate the values corresponding to the solution with the maximum global likelihood.
Current usage metrics show cumulative count of Article Views (full-text article views including HTML views, PDF and ePub downloads, according to the available data) and Abstracts Views on Vision4Press platform.
Data correspond to usage on the plateform after 2015. The current usage metrics is available 48-96 hours after online publication and is updated daily on week days.
Initial download of the metrics may take a while.