Fig. 12.
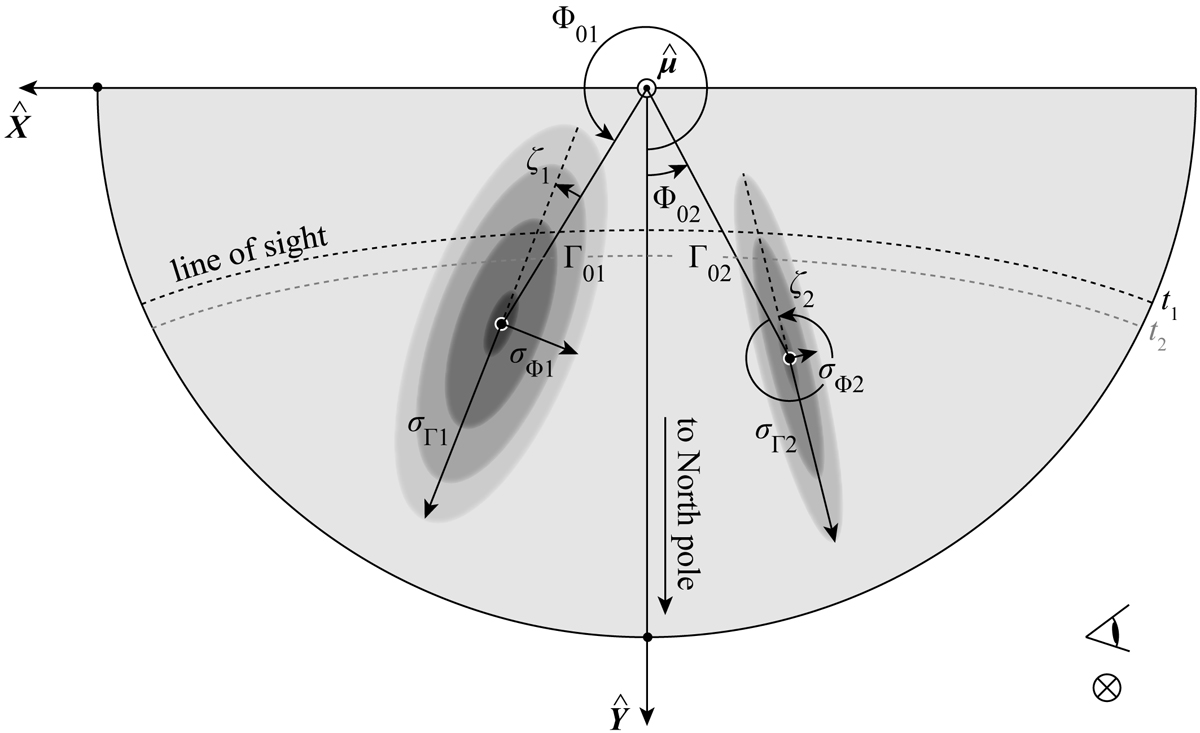
Schematic illustration of the emission beam of pulsar B, modelled in this work as a pair of Gaussian components, of which the intensity profile is represented here as greyscale contours. This figure shows a 2D projection of the emission beam on the plane of the sky and the definitions of the beam parameters that were used in our model to describe the location and shape of the emission (Eq. (10); compare with Fig. C.1). The white circles at the centres of the elliptical contours show the locations of maximum beam intensity. In this representation, the observer’s LOS is perpendicular to the plane of the paper (as denoted by the circled cross). The circled dot at the top of the figure shows the direction of the magnetic axis (![]() ) in this projection pointing out of the plane of the paper, towards the observer. The black and grey dotted lines show two examples of the trace of the LOS across the beam, at epochs t1 and t2(> t1), respectively.
) in this projection pointing out of the plane of the paper, towards the observer. The black and grey dotted lines show two examples of the trace of the LOS across the beam, at epochs t1 and t2(> t1), respectively.
Current usage metrics show cumulative count of Article Views (full-text article views including HTML views, PDF and ePub downloads, according to the available data) and Abstracts Views on Vision4Press platform.
Data correspond to usage on the plateform after 2015. The current usage metrics is available 48-96 hours after online publication and is updated daily on week days.
Initial download of the metrics may take a while.