Fig. 11.
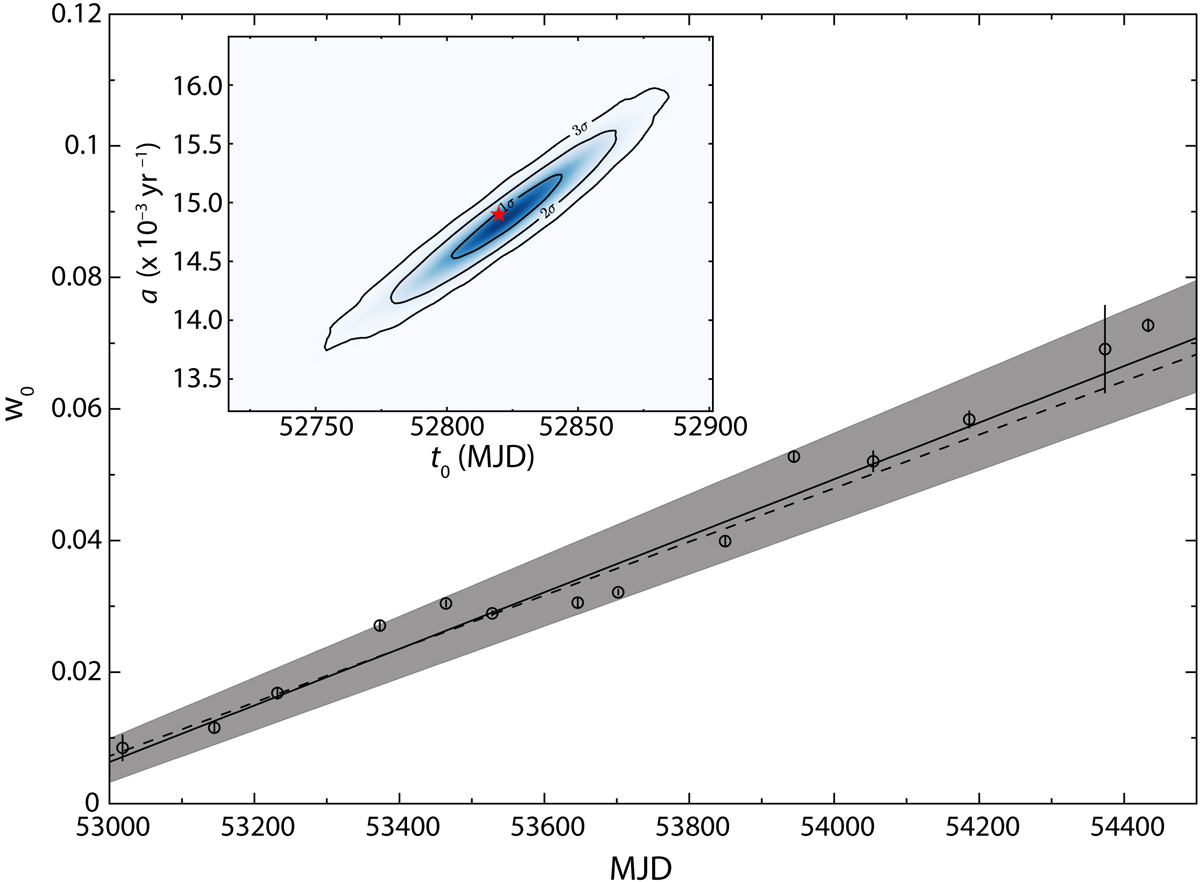
Orbit-averaged wind magnitude (w0) as a function of MJD (data points) from fits of Eq. (9) to the residuals in each of the MJD bins shown in Fig. A.1. The solid grey line and the shaded area correspond to the linear fit to the data and the 1σ confidence interval of the best fit, respectively. The inset figure shows the 2D joint probability-density function of the rate of change of w0 with time (a) and the reference MJD, t0 (at which w0 = 0), given the entire data set of residuals. The red star symbol corresponds to the location of the most likely values of a and t0. The dashed line corresponds to the most probable function that describes the evolution of w0 with time.
Current usage metrics show cumulative count of Article Views (full-text article views including HTML views, PDF and ePub downloads, according to the available data) and Abstracts Views on Vision4Press platform.
Data correspond to usage on the plateform after 2015. The current usage metrics is available 48-96 hours after online publication and is updated daily on week days.
Initial download of the metrics may take a while.