Fig. 1.
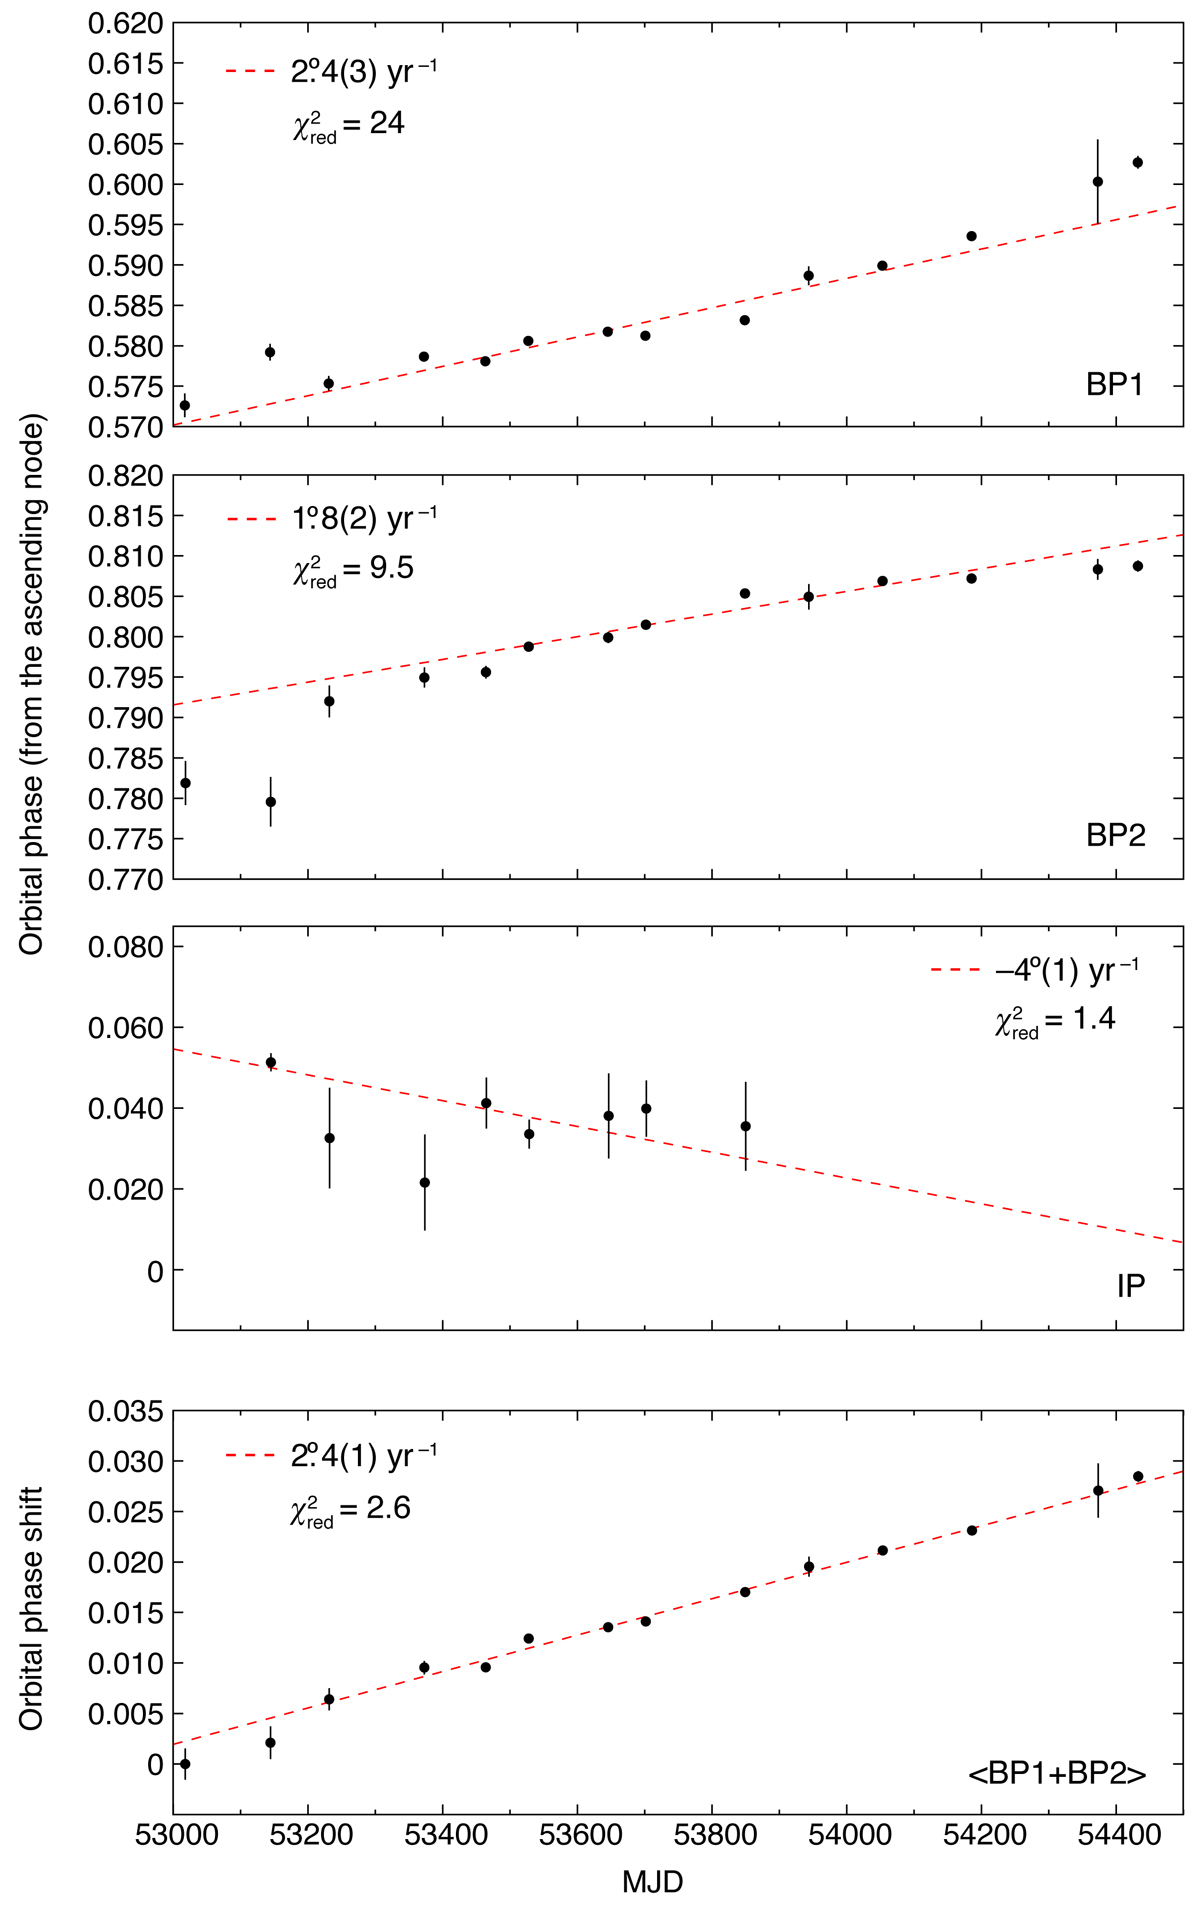
BP1,BP2 and IP: Orbital-phase evolution of the centroids of BP1, BP2, and the IP as a function of MJD epoch. The abscissa values correspond to the mean MJD across each bin (see Table 2). The dashed red lines are the best linear fits to the data; the slope and reduced chi-squared of each fit is shown in the legend. ⟨BP1+BP2⟩: The average orbital-phase shift of the centroids of BP1 and BP2 as a function of MJD epoch; the best linear fit is shown with a dashed red line.
Current usage metrics show cumulative count of Article Views (full-text article views including HTML views, PDF and ePub downloads, according to the available data) and Abstracts Views on Vision4Press platform.
Data correspond to usage on the plateform after 2015. The current usage metrics is available 48-96 hours after online publication and is updated daily on week days.
Initial download of the metrics may take a while.